The HyperGraph 2D Plot browser resides on a tab in the tab area sidebar and allows you to view the HyperGraph 2D plot structure. The Plot browser tools allow you to search, display and edit entities and their properties within the current session. The plot structure is viewed as a flat, listed tree structure within the browser. However, if the plot has a hierarchy, then the Plot browser accommodates this hierarchical structure. From the Plot browser, you can select entities one at a time or several simultaneously using common selection techniques. You can also use the browser's context-sensitive menus to select entities. Using the Plot browser, you can perform many of the operations available in the HyperGraph 2D panels, thus allowing you to modify your plot and curve properties in one location. Some of these operations include:
| • | Performing Single Curve Math and Multiple Curve Math operations |
| • | Modifying or deleting curve properties, such as: |
The Plot browser can be turned on or off using the View > Browsers > HyperGraph 2D > Plot menu options. A check mark indicates that the HyperGraph 2D Plot browser is activated for display in the Tab Area.
Note The Plot browser can also be positioned to appear on the right side of the page (the right tab area).
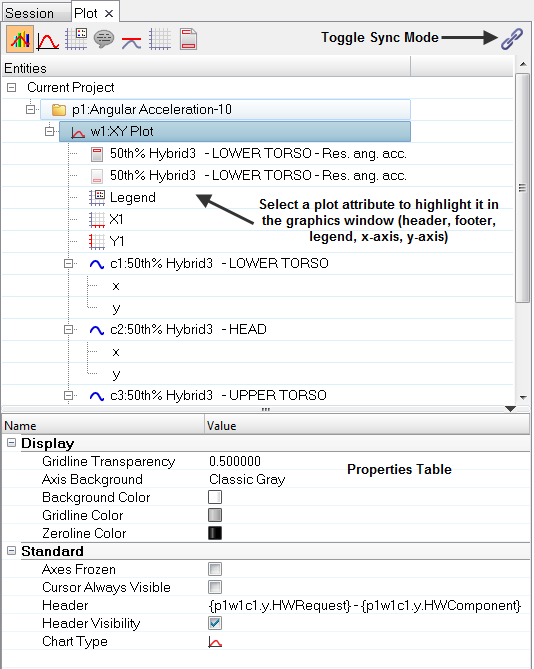
HyperGraph 2D Plot Browser with the Plot View Selected
|
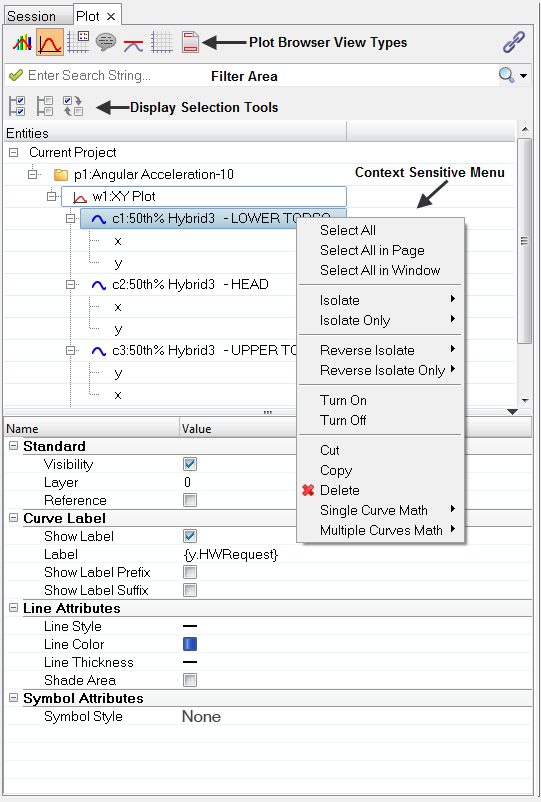
HyperGraph 2D Plot Browser with the Curve View Selected
|
See Also:
For more information on using the Plot browser, see the following topics in the HyperGraph 2D help.
Plot Browser Views
Plot Browser Filters
Context Sensitive Menu
Properties Table
Properties


