Plot Browser |

|

|

|

|
|
Plot Browser |

|

|

|

|
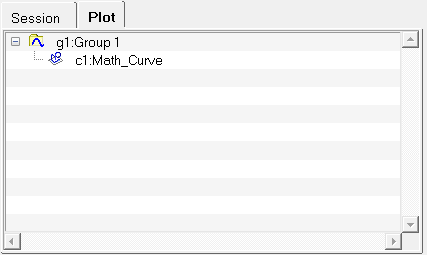
The Plot browser resides on a tab in a tab area sidebar. It displays your sessions's current plot structure in a tree structure.

HyperGraph 3D Plot browser
The HyperGraph 3D Plot Browser can be turned on or off using the View > Browsers > HyperGraph 3D > Plot menu options. A check mark indicates the Plot browser is activated for display in the tab area.
Note The Plot browser can also be positioned to appear on the right side of the page (the right tab area).