HyperWorks Desktop

Flexible Report Templates

Flexible Report Templates

Previous topic Next topic Expand/collapse all hidden text  

Flexible Report Templates

Previous topic Next topic JavaScript is required for expanding text JavaScript is required for the print function  

A report is used to automate the generation and presentation of standard animations, plots, and tables.  The content and layout of a report is defined by a report definition.  A report definition specifies how to post-process result information for a particular test or analysis data file.  Report definitions typically consist of a series of pages containing HyperView, HyperGraph, and TextView windows.

The Flexible Report Templates panel allows you to add or overlay predefined page sets to the current session.  This replaces the Reports panel from earlier HyperWorks Desktop versions.  The panel allows you to easily compare test and simulation data.  In addition to the standard Report panel features, Channel Mapping is available, which allows you to reconcile mismatched channels (Type, Request and Component data).  You can save the reconnected channels to a configuration file and use this file later.  From the panel, you can directly edit parameter attributes for parameters created with the Parameter browser.

To access the Flexible Reports Templates panel, click the Open Report Panel icon, report-24, from the Reports toolbar.

reports_panel

Flexible Report Templates dialog

hmtoggle_plus1greyReport Templates

To add a report template, click Add to display the Open Report template dialog and select your report template.

To delete a report template from the dialog, select it from the Report Templates list and click Delete.

Parameter

The Parameter list displays the parameters included in the currently selected report template.

Current Parameter Value

This column lists the value of the corresponding parameter in the Parameter column.  You can select the parameter to edit it directly.

The check box next to the plot file parameter indicates whether or not HyperWorks Desktop uses the file.  When deactivated, HyperWorks Desktop will not generate curves from those unchecked files.  Any curve referencing these curves will also not be generated.

Default Parameter Value

This columns lists the default values for each parameter listed in the dialog.  It is a non-editable field.  By default, this column is hidden. Press the arrow, flexible_report_arrow, to display the column.

hmtoggle_plus1greyChannel Mapping

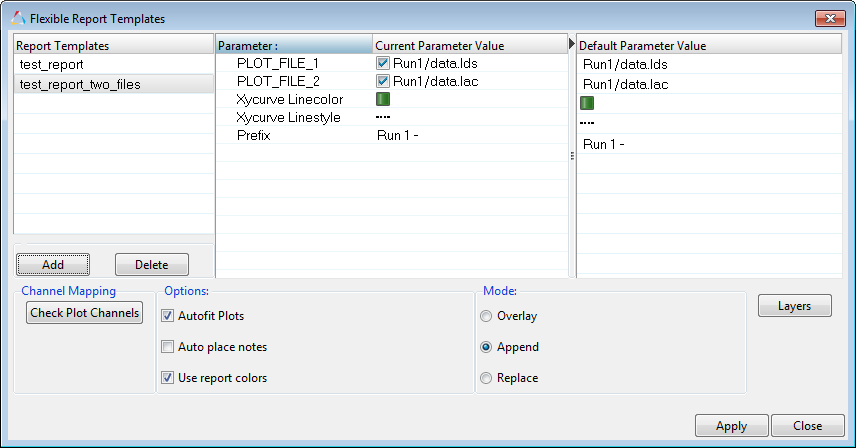
The Channel Mapping feature adds flexibility to HyperGraph by allowing you to reconcile reports with mismatched channels.  After loading a report template and selecting it from the Report Templates list, click Check Plot Channels to display the Channel Mapping dialog. HyperGraph checks the data types, requests, and components between the files and displays the matched and unmatched channels in the dialog. All channels referring to a file can be skipped, and you can check and reconnect their types, requests and components in case there is a mismatch.  If there is an unmatched channel and you select a component from one of the drop-down menus (Data Type, Request or Component) to correct it, HyperGraph automatically fixes the other mismatched components.  Mismatched channels are displayed with a red x_icon next to them.  A green check mark, check_icon, indicates a match.

flexible_report_channel_mapping

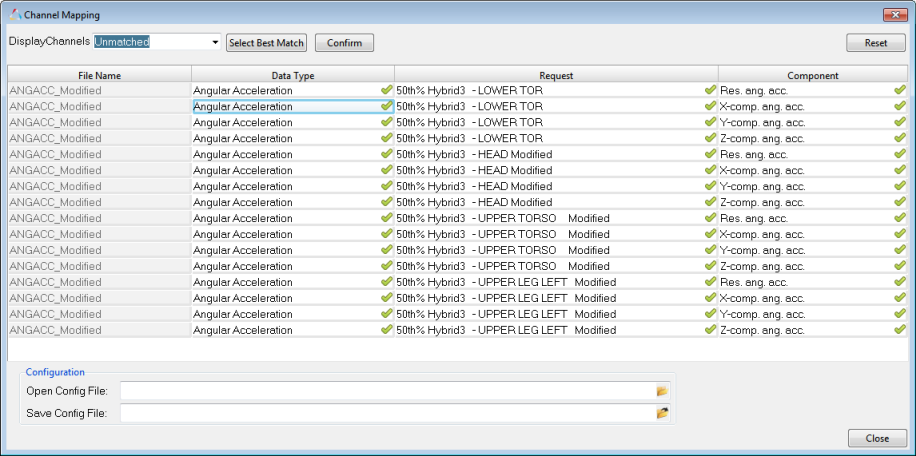
Channel Mapping dialog with mismatched channels

flexible_report_channel_mapping_matched

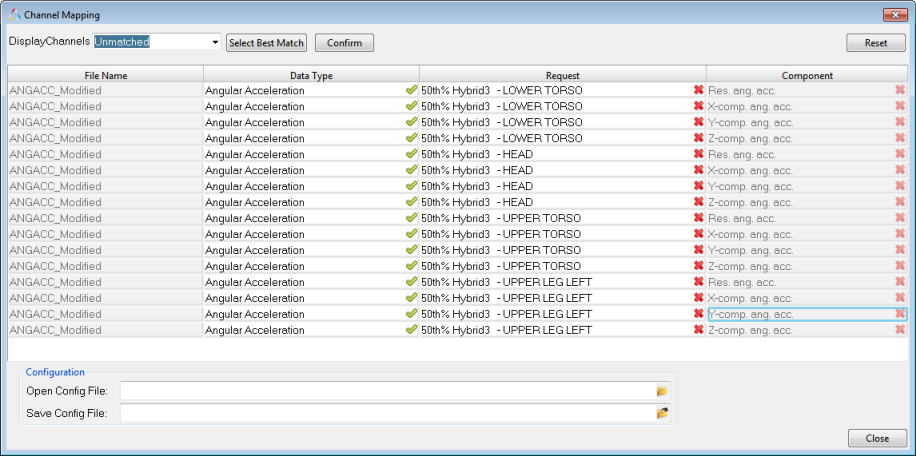
Channel Mapping dialog with matched channels

Filtering and Sorting Data Lists

The Channel Mapping dialog contains filtering and sorting functionality to facilitate matching the data type, request, and component channels, along with other display and filtering options related to the lists that are displayed in the Data Type, Request, and Component fields.

Option

Description

Display Channels

Select All to display all channels.

Select Matched to only display the matched channels.

Select Unmatched to only display the unmatched channels.

The following options are available in the filter area at the top of the Channel Mapping dialog.

Select Best Match

Inserts the best matches into the selected fields, according to the matching algorithm.  The results are sorted using a string match to the shortest distance.  The icon to the right of the field changes from this, x_icon, to a yellow star, star_icon, upon selecting this option.

Confirm

Click Confirm to approve the current best match selections.  The icon displayed in the the selected fields is updated from this, star_icon, to this, check_icon.  

If you do not confirm the best match results, and you exit out of the Channel Mapping dialog and return to it later, the best match results will no longer be sorted and displayed. You will have to redo this operation.

Reset

Resets the fields to the default, or previous, selections.  The star_icon and check_icon icons return to the x_icon.

The options described above are also be available via a context menu if you right-click while one or more fields are selected from the dialog, as shown below.  You can select only some of the channels listed and choose Select Best Match from the context menu to sort the currently selected channels.  Click Confirm to approve the results.

flexible_report_channel_context_menu

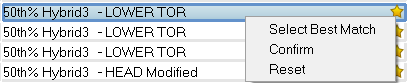
Note   If the buttons at the top of the dialog are used, the actions are applied to all channels; if the context menu is used, the actions are only applied to the selected channels.

Once the channel mappings are resolved, click Save Config File to save the reconnected channels to configuration file which can be used for future mappings.

Click the file browser icon in the Open Config File field to load a previously saved configuration file to correct any unmatched channels.  Once loaded, you can click Apply on the main panel to plot your results.

Sorting Node IDs

You can also sort a large number of Node IDs in the Channel Mapping dialog.

Whether you are sorting the entire table or only a certain number of selecting items using the context menu, Select Best Match sorts the entire list, and displays the lists beginning with the closest match.  Click Confirm to display the sorted list of Node IDs in the drop-down menu.

Note    When you choose Select Best Match, the sorted list is always displayed in the drop-down list.  If you don't click Confirm to approve the best match, or if you click Reset, the original list is displayed.

hmtoggle_plus1greyModes

Each time a report definition is loaded, you can overlay, append, or replace the pages of the new report.

Overlay Mode

Combines report animations and plots for comparison in the session.  Report definitions with different names can be overlayed if they have the same layout, which means the same number of pages, where each page has the same page layout and the same number of clients per window.  If the report layout does not match, the report is added to the end of the session.

If Overlay is selected with HyperView or TextView windows, the existing window is overwritten.

When plots are overlaid, the axis of the existing plot is rescaled to match the overlaid plot and the curve colors assigned in the report definitions are retained.  The axis of the existing plot can be preserved and new colors can be assigned to same-color curves using the following overlay options:

Options

Option

Description

Autofit plots

Locks the axis of the current plot so that it does not change as new plots are overlaid.

Auto place notes

Automatically fits any notes you add to the window.

Use report colors

When selected, line colors, line styles, symbol colors, and symbol styles are applied based on the report template.  When the Use report colors check box is not selected, curve lines and symbols are colored based on the default colors specified in the preferences file.  In both cases, the report template controls the display of curve lines and symbols.

Append Mode

Adds a report to the end of the current report.

Replace Mode

Replaces an existing report with a new report.  Report definition names must match.  If report definition names do not match, the report is added to the end of the session.

Note:When replacing and overlaying reports, matching report definitions must be used.  If a page has been removed from a report during a session, the data for that page is ignored when replacing or overlaying.
hmtoggle_plus1greyApply

Select Apply to append, replace, or overlay new pages.  When using Overlay and Replace in situations where multiple applications of the same report exist, the program asks you to select the correct report to overlay or replace.

hmtoggle_plus1greyLayers

Select Layers to turn on and off the overlaid plots on a page.

By creating multiple report definitions, you can quickly post-process result information from various test and analysis sources.  Report definitions can be interactively added to a session by adding separate report definition files.  Report definitions can be placed directly in a session file or registered in your preference file so they are automatically loaded at startup.   Report definitions added from the preferences file are not saved to the session file.

hmtoggle_plus1greyWorking with Layers

A Layers button has been added which allows you to turn on/off the display of the various layers (all layers included in each individual report template are affected).

Note     Cells created by overlaying reports in TableView will not belong to a layer and therefore cannot be turned on/off via the Layer panel.

You can access the following context menu options by right-clicking within the Layers dialog:

Option

Description

Delete

Deletes the selected layer.

Note  Curves associated with the layer will be deleted in HyperGraph; models in HyperView or cells in TableView will not be deleted.

Rename

Renames the selected layer.

If you overlay two report templates, you will lose all the "saved" parameters.