In this tutorial you will learn how to:
| • | Append and use the Vehicle Safety Tools |
Tools
The Plot Macro panel can be accessed in one of the following ways:
| • | Click the Plot Macros icon  |
Or
| • | From the menu bar select Curves > Plot Macros |
This panel allows you to create macros that produce curves and notes for plots. Plot macros can be used to capture and replay frequently used curve operations such as adding two curves together and filtering curves.

Defining a plot macro consists of two steps:
| 1. | Define the parameters (variables of type curve or scalar) needed to create the curve. |
| 2. | Define the curve using the parameters. |
Plot macros created from the Plot Macros panel are saved to the session file.
To load Vehicle Safety Tools:
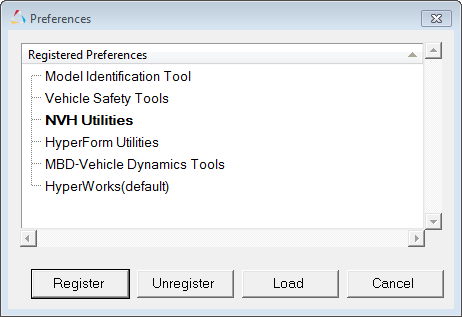
| 1. | From the menu bar select File > Load > Preference File. |
| 2. | Select the Vehicle Safety Tools preference file and then click Load. |

The vehicle safety tools (VST) are a collection of over 200 macros, Templex functions, and external functions used by vehicle safety engineers. On appending the VST file, seven new menus that contain the macros and functions are displayed on the menu bar: Math, Filter, Units, Injury, Misc, Transforms and Safety Tools.

Selecting a tool (macro) from one of these menus takes you to the Plot Macros panel.
Context Sensitive Menu
When the VST are loaded, you can access its macros by right-clicking on a curve and selecting a macro from the pop-up menu. The pop-up menu can be customized.
Exercise: Create a Plot Macro for the SAE J211 Filter Function
Step 1: Define the macro’s first parameter.
| 1. | Click on the Plot Macros panel icon  . . |
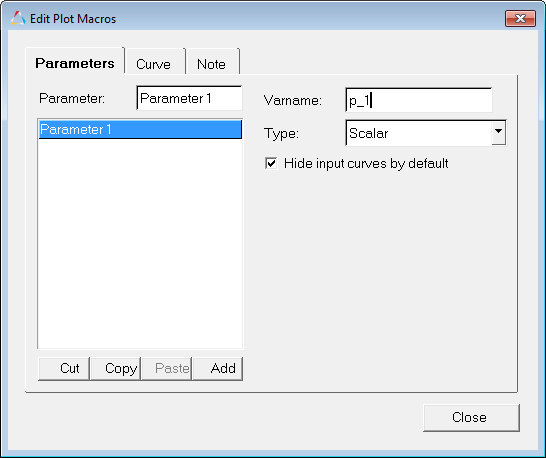
| 2. | Click Add to create a new macro and open the Edit Plot Macro dialog. |
| 3. | On the Parameters tab, click Add to create the first parameter. |
A parameter named Paramenter1 is displayed in the Parameters list and is highlighted.
| 4. | In the Parameter: field, replace the name Parameter1 with raw data curve and then press ENTER. |
| 5. | In the Varname: field, replace the name p_1 with curve and press ENTER. |
The variable name references the parameter in the macro's definition.
| 6. | Set the parameter’s Type: to Curve. |

Step 2: Define the macro’s second parameter.
| 1. | Click Add to create the second parameter. |
| 2. | In the Parameter: field, replace the name Parameter2 with SAE J211/1 filter class. |
| 3. | In the Varname: field, replace the name p_2 with class. |
| 4. | Set the parameter’s Type: to Scalar. |
Step 3: Define the macro’s third parameter.
| 2. | Change the parameter’s name to padding. |
| 3. | Change the parameter’s variable name to padding. |
| 4. | Verify Type: is set to Scalar. |
Step 4: Define the macro’s fourth parameter.
| 1. | Add a fourth parameter. |
| 2. | Change the parameter’s name to direction. |
| 3. | Change the variable’s name to direction. |
| 4. | Verify Type: is set to Scalar. |
Step 5: Define the macro’s curve label.
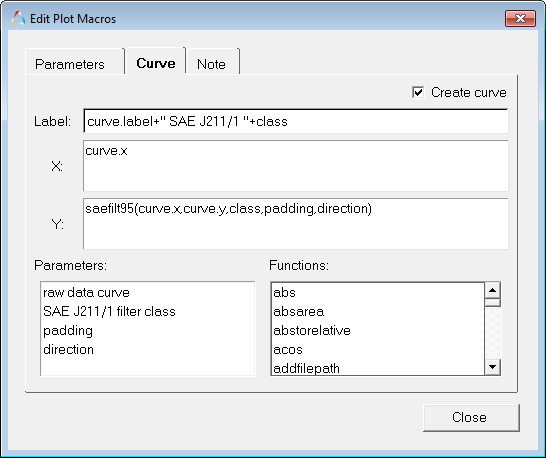
The curve label should be curve.label+" SAE J211/1 "+class.
| 1. | From the Curve tab, click the Label field. |
| 2. | From the Parameters list, double-click raw data curve. |
curve.label is displayed in the Label field.
| 3. | In the Label field, add +" SAE J211/1 "+. |
curve.label+" SAE J211/1 "+ is displayed in the Label field. The + symbol connects the string of variables and text.
| 4. | From the Parameters list, double-click SAE J211/1 filter class. |
curve.label+" SAE J211/1 "+class is displayed in the Label field.
Step 6: Define the curve’s x vector.
The curve’s x vector should be curve.x.
| 2. | From the Parameters list, double-click raw data curve. |
curve.x is displayed in the X: field.
Step 7: Define the curve’s y vector.
The curve’s y vector should be saefilt95(curve.x,curve.y,class,padding,direction).
| 2. | From the Functions: list, double-click saefilt95. |
saefilt95(,,,,) is displayed in the Y field.
| 3. | From the Parameters list, double-click raw data curve. |
saefilt95(curve.y,,,,) is displayed in the Y field.
| 4. | In the Y field, change curve.y to curve.x. |
| 5. | Position the cursor after the first comma. |
| 6. | From the Parameters list, double-click raw data curve. |
saefilt95(curve.x,curve.y,,,) is displayed in the Y field.
| 7. | Position the cursor after the second comma. |
| 8. | From the Parameters list, double-click SAE J211/1 filter class. |
saefilt95(curve.x,curve.y,class,,) is displayed in the Y field.
| 9. | Position the cursor after the third comma. |
| 10. | From the Parameters list, double-click padding. |
saefilt95(curve.x,curve.y,class,padding,) is displayed in the Y field.
| 11. | Position the cursor after the fourth comma. |
| 12. | From the Parameters list, double-click direction. |
saefilt95(curve.x,curve.y,class,padding,direction) is displayed in the Y field.
| 13. | Close the Edit Plot Macro dialog. |
| 14. | In the Macro: field, change the name macro1 to SAE J211/1 filter and press ENTER. |
| 15. | Save the session file as SAEJ211_macro.mvw. |

Step 8: Apply the SAE J211/1 filter macro.
| 1. | From the menu bar, select File > Open > Session and select the file saefilter.mvw, located in the plotting folder. |
Even though a new session file is opened, the SAE J211/1 filter macro remains in the session until HyperGraph is closed.
| 2. | Enter the Plot Macros panel. |
| 3. | From the Macro list, select SAE J211/1 filter. |
| 4. | In the Parameters section of the Plot Macros panel, click the raw data curve field. |
| 5. | Hold the SHIFT key and select the curve in the plot window. |
p1w1c1 is displayed in the raw data curve field.
| 6. | Enter 60 in the SAE J211/1 filter class field. |
| 7. | Enter 1 in the padding field. |
| 8. | Enter 3 in the direction field. |
| 9. | Verify the option Layout: Place new curves in original plots is active. |
| 10. | Deactivate the option Hide input curves. |
| 11. | Click Apply to create the filtered curve. |
This plot macro can be reused for any number of input curves to quickly repeat the curve filtering process.
Go to HyperGraph 2D Tutorials


![]()

