Flow Stress/Viscosity Graph |

|

|

|

|
|
Flow Stress/Viscosity Graph |

|

|

|

|
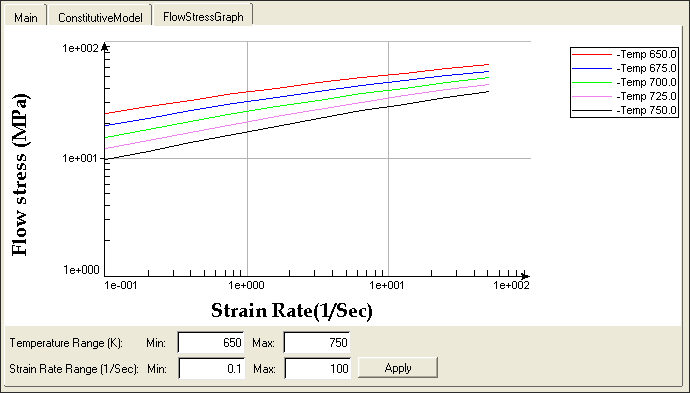
The Material Database Editor also includes flow stress graphs for each material. These graphs display the flow stress (or viscosity for polymers) vs. strain rate for a range of temperature values.

You can also adjust the displayed ranges for both temperature and strain rate. Type the new ranges in the boxes (lower value in the left box and higher value in the right box) and click Apply.