Introduction
In this tutorial you will learn to:
| • | Import a MotionSolve result (plot) file for plotting curves |
| • | Plot multiple curves in a single window |
| • | Plot multiple curves in different windows on a single page |
| • | Save your work as a session (mvw) file |
Theory
The Build Plots panel allows you to import plot files that can be plotted in a 2D layout. The panel allows you to control what curves are to be plotted either in single or multiple windows.
Tools
The Build Plots panel can be accessed in any one of these three applications: MotionView, HyperView or HyperGraph.
Copy the Demo.plt file, located in the mbd_modeling\plotting folder, to your <working directory>.
Step 1: Opening a plot file.
| 1. | Start a new MotionView session. |
| 2. | Select HyperGraph 2D from the Select application menu,  , on the toolbar. , on the toolbar. |
The toolbar is located right below the plot window.
| 3. | Click the Build Plots icon,  , on the toolbar. , on the toolbar. |
| 4. | Click the Open File icon,  , on the Build Plots panel. , on the Build Plots panel. |
| 5. | Select the file <working directory>\Demo.plt. |
This file contains several curves.
| 7. | Confirm that Time is selected under X Type:. |
| 8. | For Y Type: click on Displacement to select it. |
The Y Request text box displays the data available in the file.
| 9. | Click the Y Request expansion button  to view the Y Request list. to view the Y Request list. |
| 10. | Press CTRL button on the keyboard and click on REQ/70000006 and REQ/70000007 (or left-click and drag the mouse to select both REQ/70000006 and REQ/70000007). Click OK. |
| 11. | Select X under Y Component:. |
| 12. | Set Layout as one plot per Component. |
Two curves are plotted in the plot window, each with its own line type and color. The legend identifying the curves is located in the upper right hand corner of the plot.
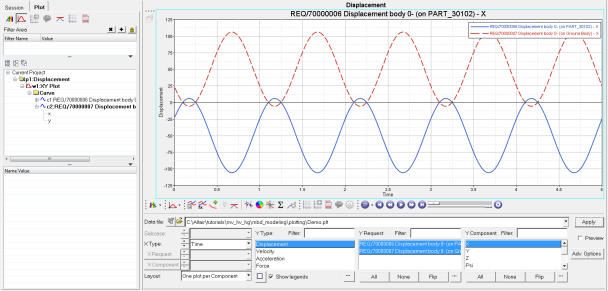
Single plot window with multiple curves created using the Build Plots panel
Step 2: To build multiple curves on multiple plots using the plot file.
In this step you will select multiple curves and plot them in multiple windows.
| 1. | Stay in Build Plots panel. |
| 2. | Leave Time selected under X:. |
| 3. | Leave Displacement selected under Y Type:. |
| 4. | Leave REQ/70000006, and REQ/70000007 selected under Y Request:. |
| 5. | Press CTRL and under Y Component: select X, Psi, MAG and RMAG. |
| 6. | Select One plot per Component from the Layout pull down menu  , located in the lower left corner of the panel. , located in the lower left corner of the panel. |
This selection creates one plot for every request selected under Y component. There will be four plots created. You could have one page for each plot. However, this tutorial wants all four plots on the same page.
| 7. | Click the Page Layout button  , located next to the Show Legends check box. , located next to the Show Legends check box. |
| 8. | Select the four window layout option  . . |
The Page Layout dialog automatically closes.
A second page is added to the page list with four windows and the plots you requested.
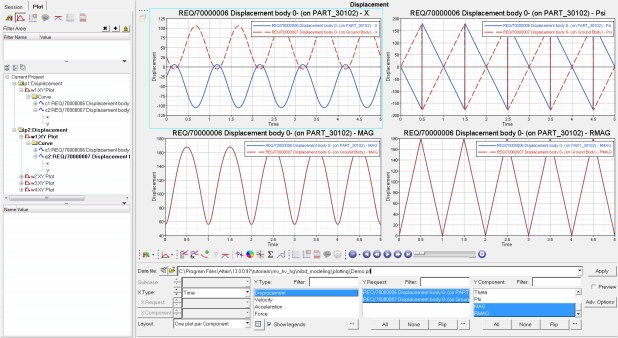
Multiple plots with multiple curves created using the Build Plots panel
| Note | The procedure to plot and edit curves from other result/request files (for example, .req, .abf, etc.) remains the same as described in this tutorial. |
Step 3: To save this work session.
You can save your work with multiple curves in multiple windows on multiple pages as a session file. A session allows later retrieval either for display, printing, or to continue adding more information. The session file is a script with the extension .mvw. The contents of an .mvw file are all the information in the program that gets recorded in the script file.
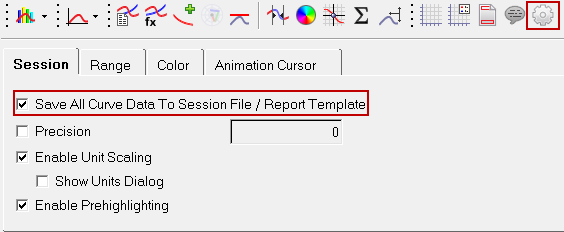
| Note | To save a session as a script file with curve data: select the Options panel icon from the Annotations toolbar, and activate the Save All Curve Data To Session File / Report Template check box (located on the Session tab). |
| 1. | From the File menu, select Save As > Session. |
| 3. | In the File name text box type Demo1.mvw. |
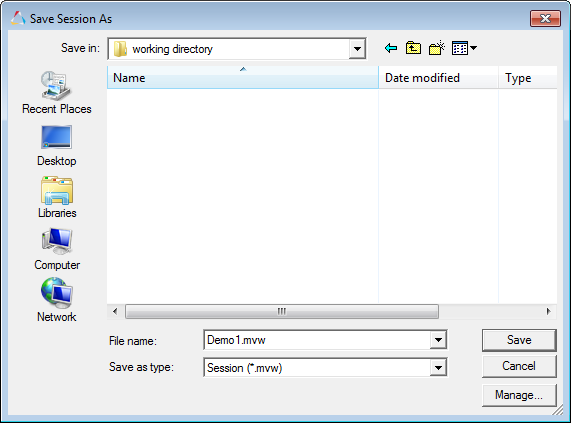
Save Session As dialog
| 4. | Confirm that Session (*.mvw) is selected from the Save as type drop-down menu. |
This saves your current work session as a session script file called Demo1.mvw.
Step 4: To exit the program.
| 1. | From the File menu, select Exit. |
A dialog displays prompting you to save the session.
| 2. | Click No, since you saved the session in the previous step. |
For more advanced plotting options, refer to the HyperGraph tutorials.


