|
»Click here to display Table of Contents«
|

Plots panel |

|

|

|

|
|
Plots panel |
|
|
|

|
|
»Click here to display Table of Contents«
|
Plots panel |
|
|
|
|
|
Plots panel |
|
|
|
|
Use the Plots panel to create and manage plot collectors. With this function you can create an entirely new plot collector or a new plot based on default values from an existing plot. If you have complex data, you can create dual plots to display real/imaginary or phase/magnitude curve data. You can also select the curves that are to be displayed on the plot.
Standard plot |
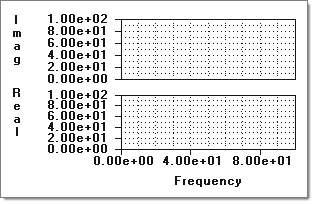
Dual plot |
There are no subpanels on the Plots panel. All inputs and command buttons are located on the main panel.
Input |
Action |
||||||
plot = |
Enter a name for the plot collector. |
||||||
like = |
If desired, click like = and specify an existing plot whose default values you want to use for the new plot. |
||||||
standard /
|
Click the switch to select standard, real/imag, or phase/mag.
CommentsAfter you create a real/imag or phase/mag plot, the standard selection is removed from the menu. |
The following action buttons appear:
Button |
Action |
create plot |
Create a new plot based on the current inputs. |
select curves |
Select the curves which you want to display from the list of curves. After you click return, the curves you selected are displayed on the plot.
|
return |
Exit the panel. |