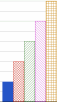
HyperWorks Desktop

*BarChartStyle()

Specifies the styles of the bar chart curves.

*BarChartStyle()

Specifies the styles of the bar chart curves.

Previous topic Next topic No expanding text in this topic  

*BarChartStyle()

Specifies the styles of the bar chart curves.

Previous topic Next topic JavaScript is required for expanding text JavaScript is required for the print function  

Syntax

*BarChartStyle(mode, labeling, gap, orientation)

Arguments

Name

Description


mode

Determines if the bar chart(s) is displayed in stack (1) or cluster (0) mode.

1 – Stack bar chart.

stack_bar_chart

0 – Cluster bar chart.

cluster_bar_chart


labeling

Determines if there is a bar chart label.

1 – Puts the total value of the bar charts on top of the bar chart stack as the label.

0 – No label.


gap

The percentage of the gap of a category interval.


orientation

Determines if the bar chart is displayed horizontally or vertically.

0 – Horizontal bar chart (the horizontal axis is the category axis).

1 – Vertical bar chart (the vertical axis is the category axis).

Example

*BeginPlot()

   *PlotType(1)

   *BarChartStyle(0, 0, 20, 0)

   *BeginLegend(On)

       *Font("Arial", 0, 0, 8)

       *BorderWidth(1)

       *Color(0)

       *Leader(Left)

       *Location(INSIDE)

       *Postion(4.4683, 11.8871, 5.22495, 9.37412)

   *EndLegend()

• • •

*EndPlot()

Application

HyperGraph.

Context

*BeginPlot().

See also


*Bar()

List of Session Statements