In this tutorial you will learn how to:
| • | Use the Append as Row and Append as Column overlay modes in Tableview |
| • | Use the Parameters Browser |
| • | Use the Flexible Reports Panel to overlay a report |
Tools
TableView creates an Excel-like spreadsheet inside of HyperWorks Desktop. You can use Templex expressions inside of a cell to synchronize with HyperGraph and create summary tables that update accordingly using report templates. Value-dependent formatting allows for the easy detection of critical key performance indicators (KPI's). Basic spreadsheet functionality to format and edit table cells is also available. You can copy data from TableView and paste it into an Excel spreadsheet, and vice versa.
To access TableView, select TableView from the client selector context menu in the Session browser.
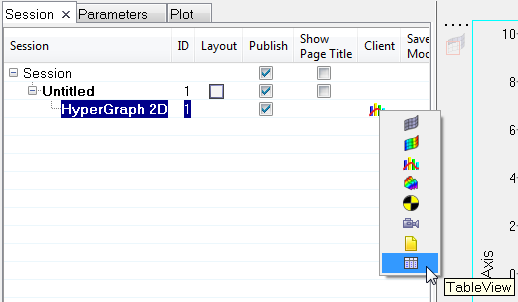
TableView option
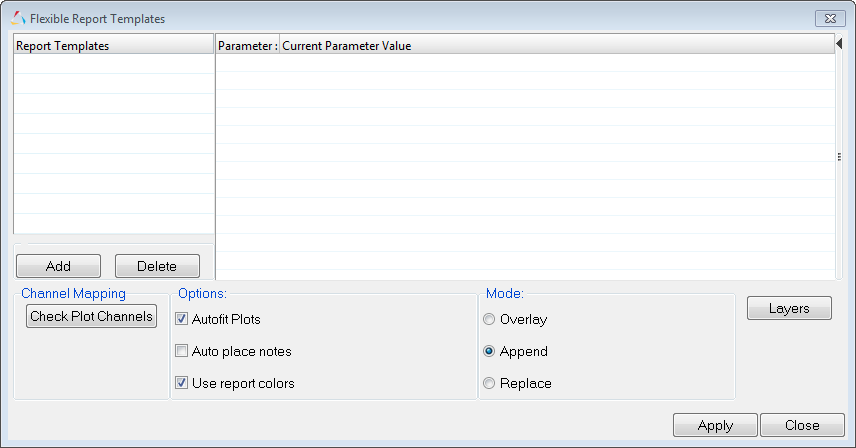
To access the Flexible Reports Templates panel, click the Open Report Panel icon,  , from the Reports toolbar.
The Flexible Report Templates panel allows you to add or overlay predefined page sets to the current session. This replaces the Reports panel from earlier HyperWorks Desktop versions. The panel allows you to easily compare test and simulation data. In addition to the standard Report panel features, Channel Mapping is available, which allows you to reconcile mismatched channels (Type, Request and Component data). You can save the reconnected channels to a configuration file and use this file later. From the panel, you can directly edit parameter attributes for parameters created with the Parameter browser.
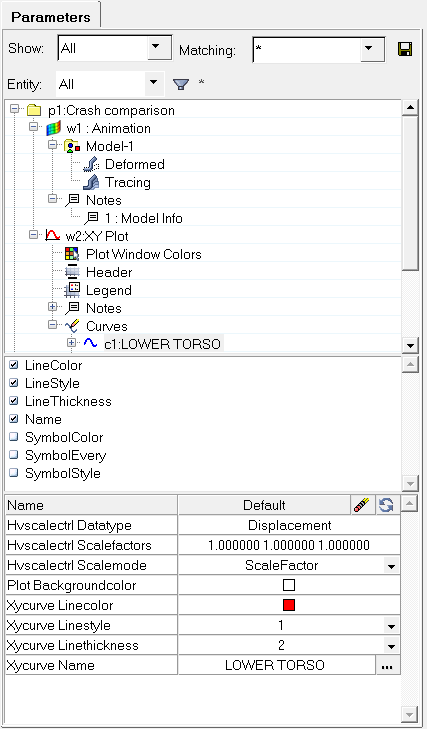
The Parameter browser, which is used with report templates, lets you parametrize almost everything in a session file or report template and automate a variety of analysis processes in HyperWorks Desktop. The reality of automation is that it is not always desirable to re-apply automation scripts exactly as they were originally defined. To remedy this, the Parameter browser includes a graphical user interface for defining parameters that can be changed when an automation script is executed. After the parameters are defined, you can save the automation script and run it from the Report Templates panel.
To display the browser, click View > Browsers > HyperWorks > Parameters.
Exercise 1: Append as column overlay mode in TableView
Step 1: Open Session File tableviewoverlayed_append.mvw.
| 1. | From the File menu, click Open > Session. |
| 2. | Select the file ../tutorials/mv_hv_hg/reports/tableviewoverlayed_append.mvw and click Open. |
Step 2: Empty curve for header label.
| 1. | The session file contains an empty curve with one blank field in it. From the curve list in the Define Curves panel in HyperGraph, click the space below the HIC curve to select the empty curve. |
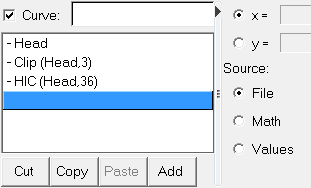
This blank curve will act as a placeholder for a column heading to be displayed later in the tutorial.
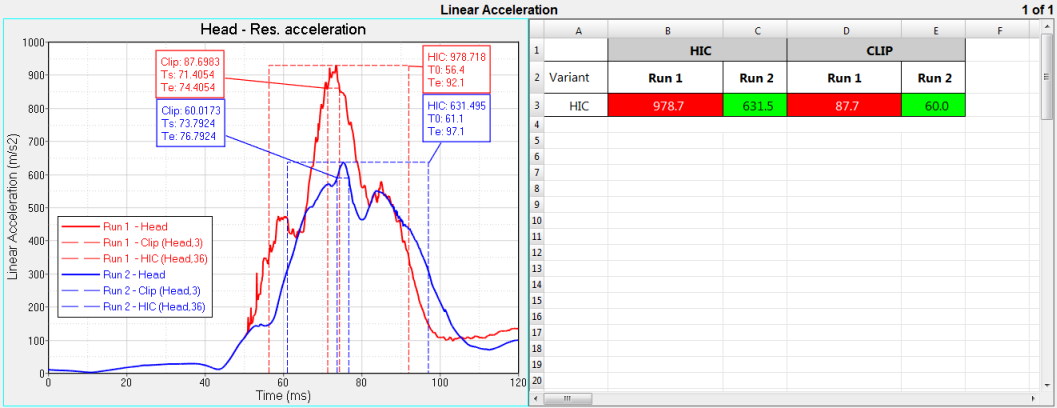
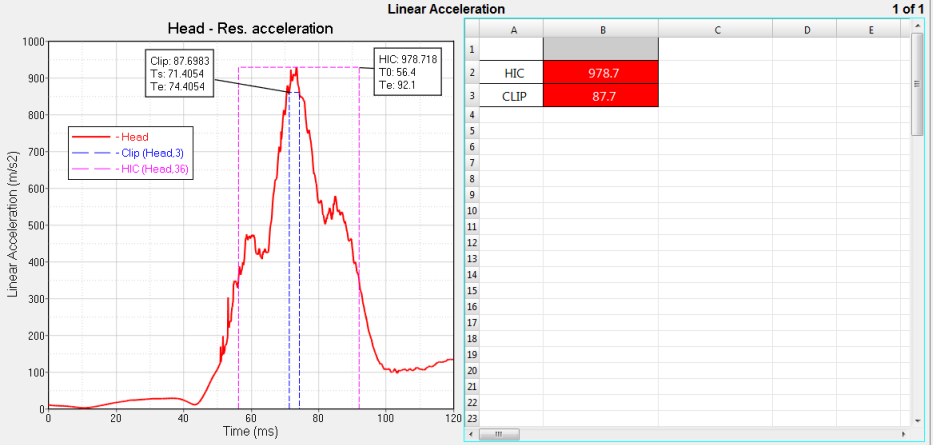
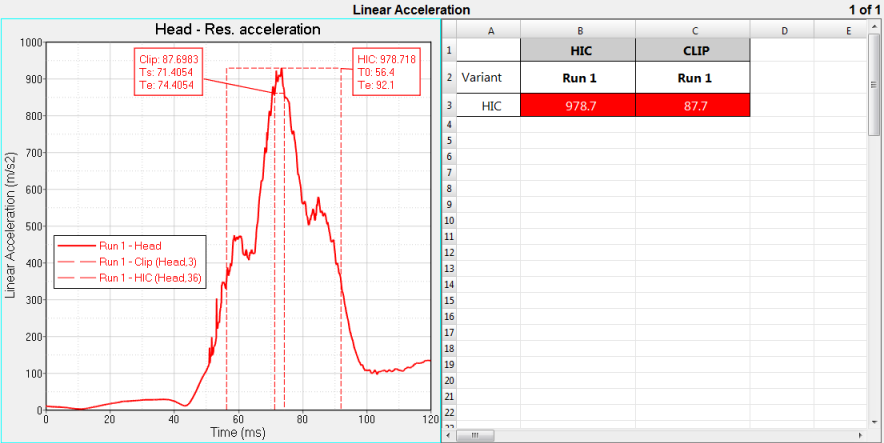
| 2. | Click the TableView window to make it the active window. Double-click on cells B1:B3 to view the Templex references in the header cells as well as the HIC and Clip values. |
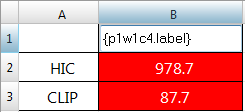
Blank cell with Templex label reference
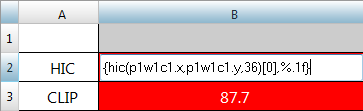
HIC curve Templex reference
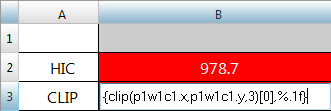
CLIP curve Templex reference
| 3. | Return to HyperGraph. Click the Curve Attributes icon,  , from the HyperGraph 2D toolbar. , from the HyperGraph 2D toolbar. |
| 4. | From the Curve list, click the blank space below the HIC curve (essentially selecting the fourth curve) to select the empty curve, and click Label Off. |
Step 3: Add and delete rules in TableView.
| Note | This step is to be used for training purposes only, to learn how rules are added and deleted. It is not necessary to perform this step for this tutorial to work. The rules are already added to the table in this demo session. |
| 1. | Click the right-side window to activate TableView. |
| 2. | From the toolbar, click the Conditional Formatting icon,  . . |
The Conditional Formatting panel can be used to define value-dependent rules and apply them as attributes within the selected cells. This allows you to easily detect critical key performance indicators (KPI's).
| 3. | Click New Rule to add a rule. |
| • | Click the cell under the Operator column and select the greater than sign from the drop-down menu. |
| • | Leave the Text Color as black. |
| • | Under Cell Color, click the color palette and select red. |
| • | Under Cells, click in the field to activate it. |
| • | Click the arrow at the end of the active cell,  , then click the cell from the graphical area to apply this rule to the selected cell. For this tutorial, select the cell B3. , then click the cell from the graphical area to apply this rule to the selected cell. For this tutorial, select the cell B3. |
| 4. | Select the row for the rule you just created and click Delete Rule to delete it. |
Step 4: Create report parameters.
The following step describes how to parametrize the report template so that the prefix that describes the solver run is displayed in the curve name as a prefix, as well as in the table header row. In addition, a parameter is created which ensures that all notes and curves from the report have the same color.
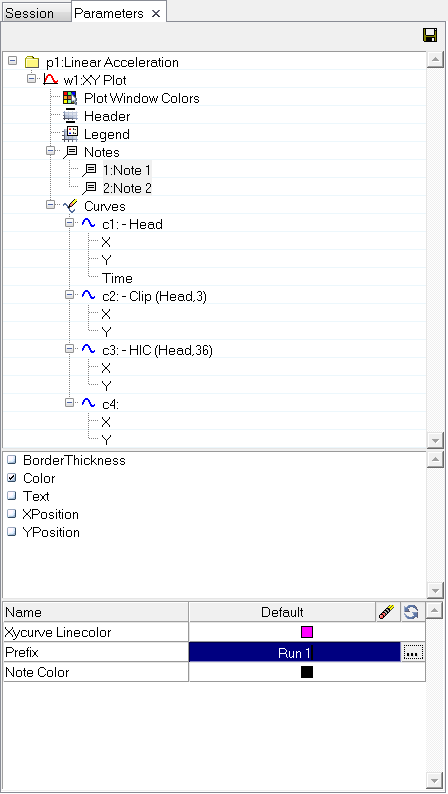
| 1. | Click View > Browsers > HyperWorks > Parameters to open the Parameters browser. |
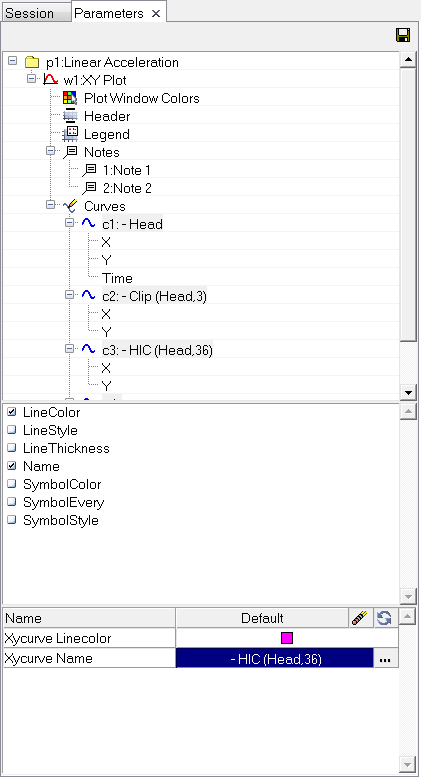
| 2. | From the browser, right-click on the top folder, p1:Linear Acceleration, and click Expand All. |
| 3. | Under Curves, select c1: Head, right-click and select Select All from the menu. This selects all the curves. |
| 4. | Select LineColor and Name. |
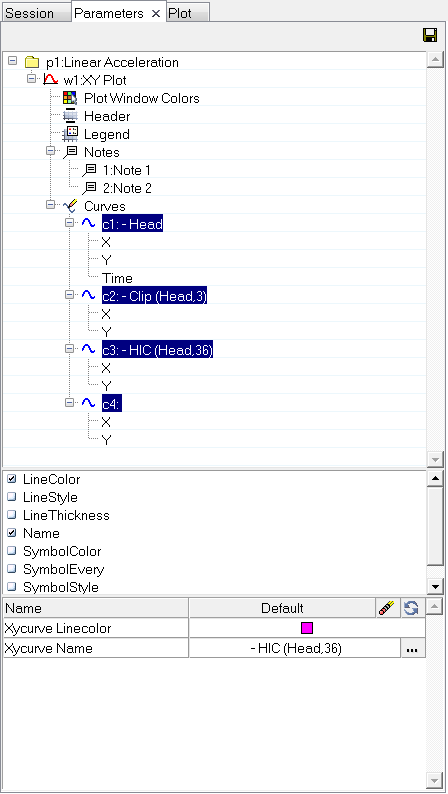
| 5. | Select Xycurve Linecolor and Xycurve Name. |
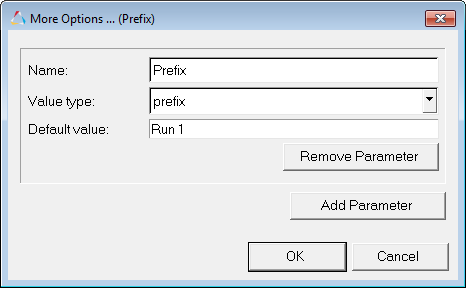
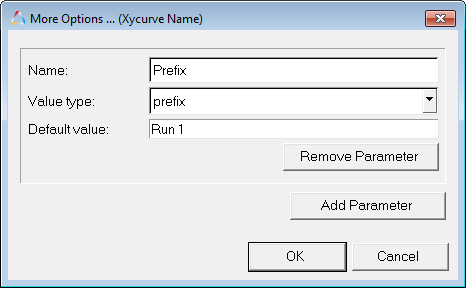
| 6. | From the parameter property table area at the bottom of the browser, click  on the right side of the row Xycurve Name to display the More Options dialog. on the right side of the row Xycurve Name to display the More Options dialog. |
| • | For Value type:, select prefix. |
| • | For Default value:, enter Run 1. |
| 8. | Under Notes, select notes 1 and 2 from the list. |
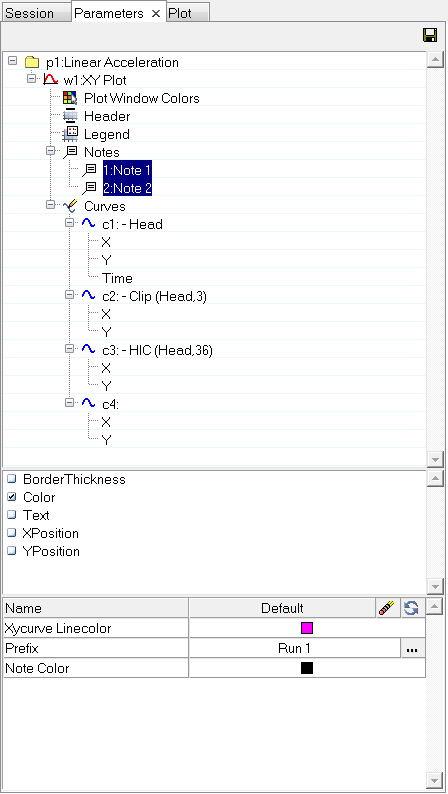
| 10. | From the table area at the bottom of the browser, select Xycurve Linecolor and Note Color, right-click, and select Merge from the context sensitive menu. |
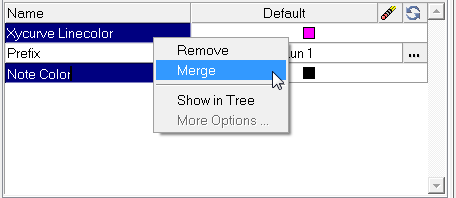
If two or more parameters are selected, this option merges them into one automation script parameter.
| Note | Only parameters of the same type should be merged (for example, color, string, and so on). |
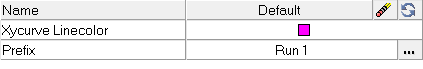
| 11. | For Xycurve Linecolor, under Default, click the color palette and select red. |
Exercise 2: Insert as column overlay mode in TableView
Step 1: Use the Overlay Mode in TableView and save the parameters as a report template.
| 2. | Select the Overlay Settings icon,  , from the toolbar. , from the toolbar. |
| 3. | From the Overlay Mode: menu, select Append as Columns. |
| 4. | Click Add Overlay Area. |
Overlay 1 is added to the list.
| 1. | Click in the area under Cells and notice the selector icon is displayed,  . . |
| 2. | Click the selector icon, and with the left mouse button, drag and select the cells B1:B3 in TableView. |

| 7. | Click File > Save As to save your session to your working directory. |
| 8. | Return to the Parameters browser. |
| 9. | Click the Save icon from the Parameters browser and save your parameterizations as a report template to your working directory. |
For File name, enter report_append_as_column1, and for Save as type:, select Report Template
The same report created by this exercise is also available in the tutorial directory.
../tutorials/mv_hv_hg/reports/report_append_as_column.tpl.
| 10. | From the Reports toolbar, click the Flexible Reports Panel icon, . |
| 11. | You will see that the report was already loaded at the time of creation. If you want to load an existing report, click Add to add the report template saved in step 9. Click Close to close the panel. |
| 12. | Click File > New > Session. Click Yes to continue with the new session. |
| 13. | Return to the Flexible Report Panel, under Mode make sure Append is selected, and click Apply. |
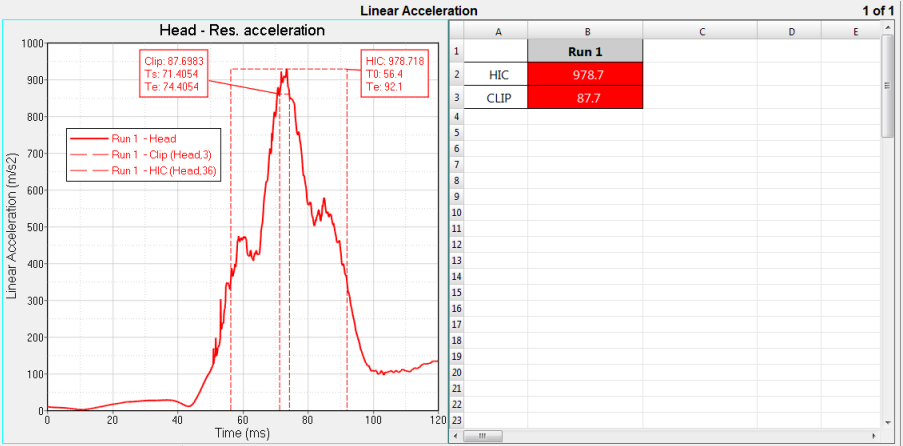
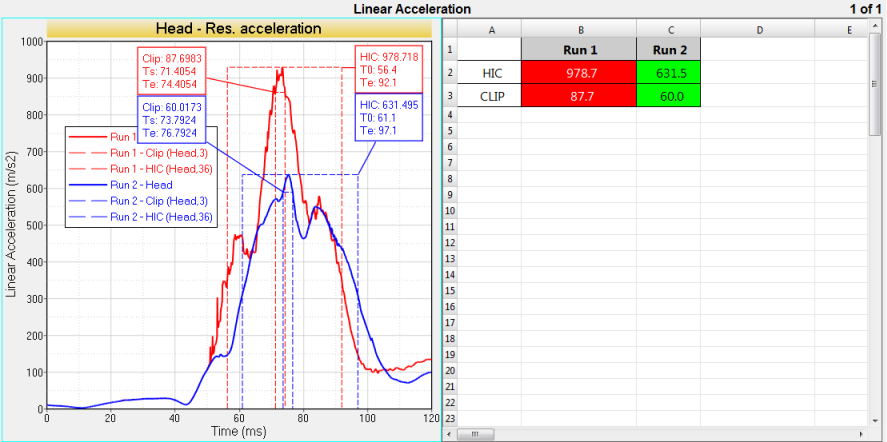
| 14. | Run 1 is added to TableView |
| 15. | From the Flexible Report Template panel, under Mode, select Overlay. |
| 16. | Under Current Parameter Value, enter the following: |
| • | For PLOT_FILE_1, use the file browser icon to go to ../tutorials/mv_hv_hg/reports/Run 2/data.lac, or just manually change Run 1 to Run 2. |
| • | Change the Color to blue. |
| • | For Prefix, enter Run 2. |
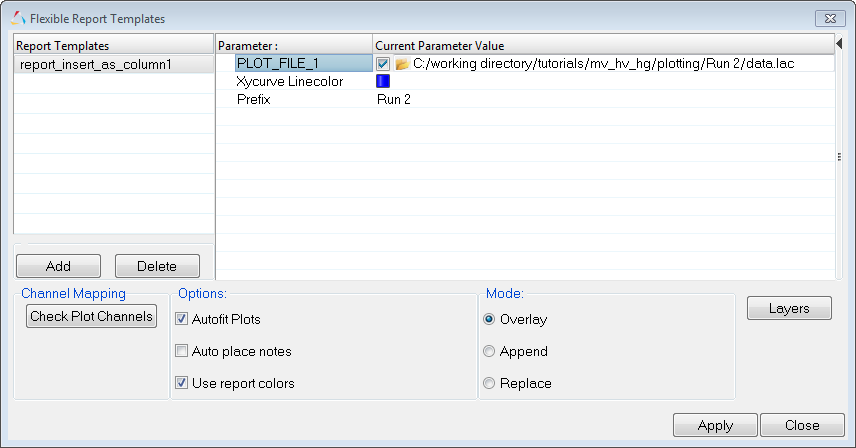
| 17. | Click Apply and Close. |
Run 2 is added TableView.
Step 2: Open Session File tableviewoverlayed_insert.mvw.
| 1. | From the File menu, click Open > Session. |
| 2. | Select the file ../tutorials/mv_hv_hg/reports/tableviewoverlayed_insert.mvw and click Open. |
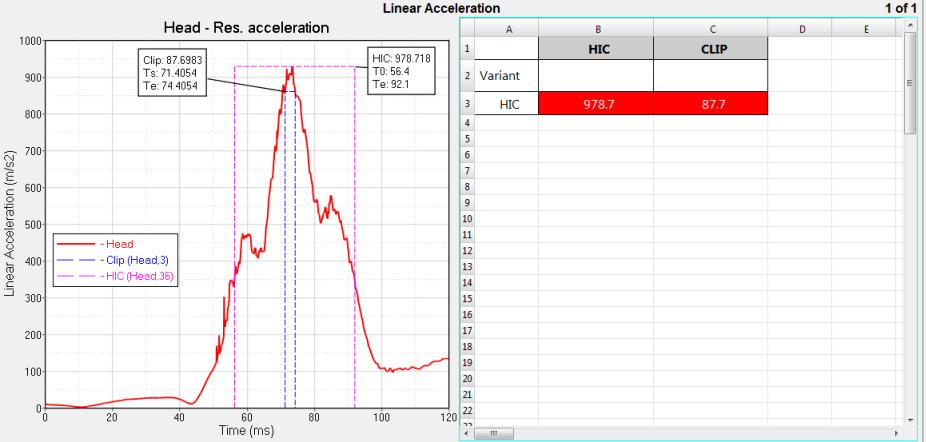
| 3. | Similar to the tableviewoverlayed_append.mvw session file, there are two empty curves being used as placeholders. Click the cells in the Variant row, under HIC and CLIP to view them. |
| 4. | Double-click on cells B1:B3 to view the Templex references in the header cells as well as the HIC and Clip values. |
Step 3: Use the Insert as Columns overlay mode.
| 1. | Go to the Overlay Settings panel, , in TableView, |
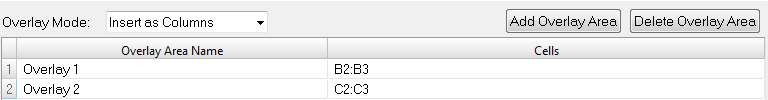
From the Overlay Mode: menu, select Insert as Columns.
| 2. | Click Add Overlay Area. |
Overlay 1 is added to the list.
| 3. | Click in the area under Cells and notice the selector icon is displayed, . |
| 4. | Click the selector icon, and with the left mouse button, drag and select the cells B2:B3 in TableView. |
| 5. | Click Add Overlay Area again to add Overlay 2. |
| 6. | Repeat steps 3 and 4 to select the cells C2:C3. |
| 7. | Click File > Save As to save your session to your working directory. |
| 8. | From the Parameters browser, right-click on the top folder, p1:Linear Acceleration, and click Expand All. |
| 9. | Under Curves, select c1: - Head, right-click, and select Select All from the menu. This selects all the curves. |
| 10. | Select LineColor and Name. |
| 11. | From the table area at the bottom of the browser, click on the right side of the row Xycurve Name to display the More Options dialog. |
| • | For Value type:, select prefix. |
| • | For Default value:, enter Run 1. |
| 13. | Under Notes, select notes 1 and 2 from the list. |
| 15. | From the table area at the bottom of the browser, select XycurveLinecolor and Note Color, right-click, and select Merge from the context sensitive menu. |
If two or more parameters are selected, this option merges them into one automation script parameter.
| 16. | Under Default, click the color palette and select red. |
| 17. | Click the Save icon from the Parameters browser and save your parameterizations as a report template to your working directory. |
For File name, enter report_insert_as_column1, and for Save as type:, select Report Template.
The same report created by this exercise is also available in the tutorial directory.
../tutorials/mv_hv_hg/reports/report_insert_as_column.tpl.
| 18. | From the Reports toolbar, click the Flexible Reports Panel icon, . |
| 19. | Click Add to add the report template saved in step 17, if not already displayed in the panel. |
| 20. | Click File > New > Session and answer Yes to continue. |
| 21. | Return to the Flexible Report Panel and under Mode, select Replace. |
Run 1 is added to TableView.
| 23. | From the Flexible Report Templates panel, under Mode, select Overlay. |
| 24. | Under Current Parameter Value, enter the following: |
| • | For PLOT_FILE_1, use the file browser icon to go to ../tutorials/mv_hv_hg/reports/Run 2/data.lac, or just manually change Run 1 to Run 2. |
| • | Change the Color to blue. |
| • | For Prefix, enter Run 2. |
Run 2 is added TableView.