Custom Plot Types |

|

|

|

|
|
Custom Plot Types |

|

|

|

|
Plots can be customized to be displayed as other plot types, such as Gauge, Pie, 3DBar and more. Scripts have been included in HyperGraph 2D to display these custom plot types. Two of these scripts contain context sensitive menus to activate the override option for the plot window.
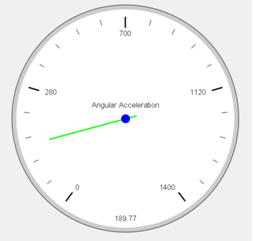
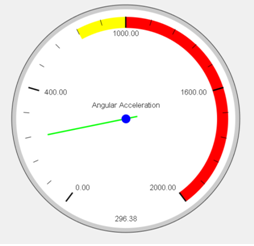
From an XY plot type, right-click in the plot window to display the context menu. In the Plot window, using the Custom Rendering context menu option, select Gauge. The Gauge plot type supports most XY features, such as Max/Min, Fixed or Scientific Notation, two Datum Lines (Red and Yellow only), fonts and more. Some XY plot features are not supported. This feature is designed for the first curve in a window only. See the example images below.


From a bar chart, you can right-click in the plot window to display the context sensitive menu. In the Bar Chart window, using the Custom Rendering context menu option, and select Pie Chart. The Pie Chart plot type supports most bar chart features such as Datum Lines, Fonts, syntax and more. Some bar chart features are not supported. This feature is designed for a single catalog in a window. See the example image below.

These scripts can be found in the [installation directory]/utility/scripts/plotting/overrides. These scripts can easily be modified to generate other custom plot types.
To turn off the custom plot type, right-click in the Plot window or Bar Chart window, select the Custom Rendering menu option and click None.