HyperGraph

Plot Type Options

Plot Type Options

Previous topic Next topic No expanding text in this topic  

Plot Type Options

Previous topic Next topic JavaScript is required for expanding text JavaScript is required for the print function  

The plot type option menu allows you to select one of four plot types: XY Plot, Bar Chart, Complex Plot, or Polar Plot. XY Plot is the default plot type.
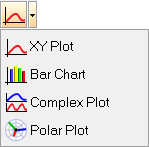
plot_type_options_menu

Plot type option menu.

The following toolbar options are available for the plot type selected:

Plot Type

Toolbar Options

XY Plot

Build Plots

Plot Macros

Define Curves

Datum Lines

Modify Curves

Curve Attributes

Coordinate Info

Statistics

Scales, Offsets, and Axis Assigments

Axes

Legends

Headers/Footers

Notes

Options

Bar Chart

Define Curves

Datum Lines

Curve Attributes

Axes

Legends

Headers/Footers

Notes

Options

Complex Plot

Build Plots

Plot Macros

Define Curves

Datum Lines

Curve Attributes

Coordinate Info

Axes

Legends

Headers/Footers

Notes

Options

Polar Plot

Build Plots

Define Curves

Tip to Tail

Datum Lines

Curve Attributes

Coordinate Info

Scales, Offsets, and Axes Assignment

Axes

Legends

Headers/Footers

Options

See Also:

Custom Plot Types