The Statistics panel,  , calculates statistics over a specified range on a curve. Click the Statistics button to display the Statistics panel.

Statistics panel
Option
|
Description
|
Template list
|
Statistics can also be generated from Templex templates. The Templates list allows you to edit and save a template supplied with the program or you can create and save a new template. The current template is displayed in the Template field.
Click Add to add a new template or Delete to delete a template from the list.
|
Range (From/To)
|
The statistics are taken from a region defined on the curve by range boundaries. The range boundaries are defined by two points on the selected curve.
Enter values in the From and To fields to define the range boundaries, or select the points on the curve from the graphics window. When you select from the graphics area, the X and Y values of each bounding point are displayed on the panel.
|
Find Point Controls
|
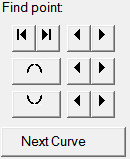
The range boundaries can also be picked using the Find Point controls.

Find Point controls.
Click:
|
To find:
|
 or or 
|
the left-most or right-most end point.
|
 or or 
|
the next point to the left or right.
|
|
|

|
global maximum of the curve.
|
 or or 
|
the next local maximum to the left or right.
|
|
|

|
the global minimum of the curve.
|
 or or 
|
the next local minimum to the left or right.
|
Next Curve
|
the corresponding point on the next curve.
|
|
Open
|
Click the file open icon,  , to load a template and display it in the text box. , to load a template and display it in the text box.
|
Save
|
Click the save icon,  , to save template changes. You can either save the template with the same name or give it a new name. , to save template changes. You can either save the template with the same name or give it a new name.
|
Calculate
|
Once the range boundaries have been specified, click Calculate to compute the curve statistics for the defined area. Each time the range markers are moved, the statistics need to be re-calculated.
|
Edit
|
Controls text editing in the text box.
Activate the Edit check box to edit text.
Deactivate the Edit check box to disable editing capabilities and display evaluated Templex statements.
|
See Also:
| 1. | Under Range, click the From radio button. |
| 2. | Pick a point on a curve using either the mouse or the Find Point controls. |
A vertical line appears representing the minimum value of the region.
| 3. | Click the To radio button. |
| 4. | Pick a point on a curve using either the mouse or the Find Point controls. |
A vertical line appears representing the maximum value of the region.
|


![]() , calculates statistics over a specified range on a curve. Click the Statistics button to display the Statistics panel.
, calculates statistics over a specified range on a curve. Click the Statistics button to display the Statistics panel. 