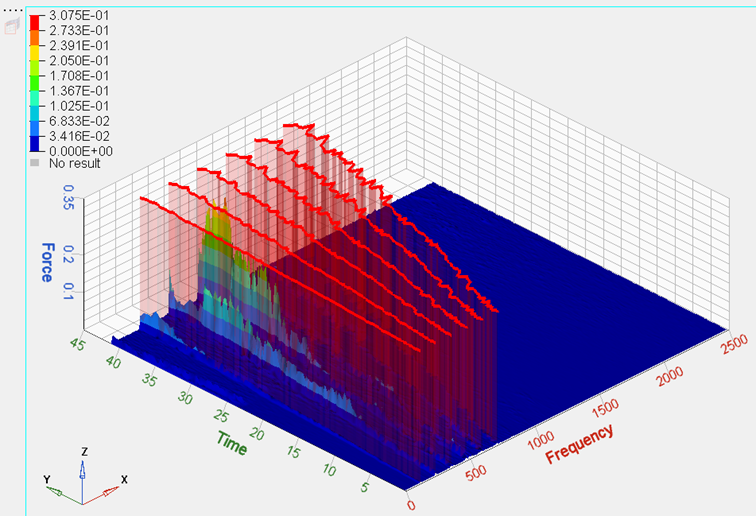
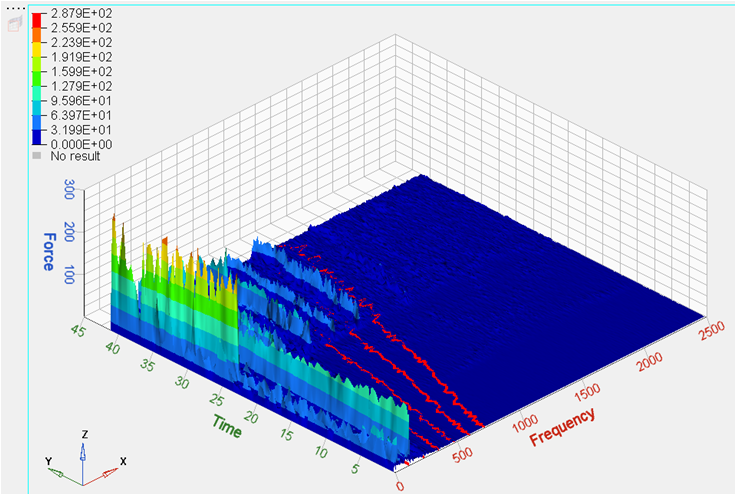
In this tutorial, you will learn how to
| • | Use the Data Query panel for Waterfall plots |
| • | Plot the orders in the HyperGraph window |
Tools
The Data Query panel can be accessed in one of the following ways:
| • | Click on Data Query panel icon,  |
Or
| • | Select Data Query from the Curves menu |
The Data Query panel uses vertical cutting surfaces for viewing and plotting non-planer cross sections. Surfaces can be defined by math expressions, specifying orders, and selecting points on the waterfall plot or 3-D surface plot.

Exercise: Querying Waterfall Plots
Step 1: Open Session File trimmer.mvw and create HyperGraph 3D window
| 1. | From the File menu, click Open. |
| 2. | Select the file trimmer.mvw, located in the 3dplotting folder, and click Open. |
| 3. | Click Close on the message log that appears. |
| 4. | Click on the Add Page  button to add a page. button to add a page. |
| 5. | From the Select Application menu, select HyperGraph 3D. |
Step 2: Create a Frequency versus Time waterfall plot
| 1. | Click on the Waterfall icon  on the toolbar to enter the panel. on the toolbar to enter the panel. |
| 2. | Verify that Frequency and Time are the options set under Plot Type:. |
| 3. | Click the curve selection icon  in the Response Field for Data Curves:. in the Response Field for Data Curves:. |
| 4. | Choose the Force vs Time – Raw curve. |
| 6. | Verify that the curve referenced under Response is p1w2c1. |
| 7. | Enter 100 for Number under Waterfall Slices. |
| 8. | Check the Contour waterfall option. |
Step 3: Creating Cut Lines Using the Data Query Panel.
| 1. | Click the Data Query icon,  . . |
| 2. | Click Add n from the panel area. |
| 3. | Select the RPM vs Time – Raw for Input and Time Vector. |
| 4. | Enter 1 – 6, for the Order List. |
| 5. | Check the Input vector is in RPM checkbox. |

Step 4: Plotting the orders in HyperGraph Windows.
| 1. | From the Data Query panel, click All next to the order list. |
| 2. | Change Layout: to One plot per cut. |
| 3. | Select the Two-Window Layout  from the layout options in the Data Query panel. from the layout options in the Data Query panel. |
| 4. | Set the Create curve: options to Y-Axis Vs Z-Axis. |
| 5. | Click Preview to preview the curves in a pop-up window. |
| 6. | Click Plot Data to create the curves. |
| 7. | Go to the Waterfall panel. |
| 8. | Select RPM vs time for the Response field. |

Note that the plots in HyperGraph windows have been updated.
Step 5: Creating a new order and positioning them
| 1. | Return to Data Query panel. |
| 2. | Click Add under Order List. |
| 3. | Left-click on an order in the Waterfall Plot to set its location. |
Note that the location of the new order is shown in the Order list in the panel.

| 4. | Select Order 1 from the Order list and repeat the previous step. |
Go to HyperGraph 3D Tutorials


