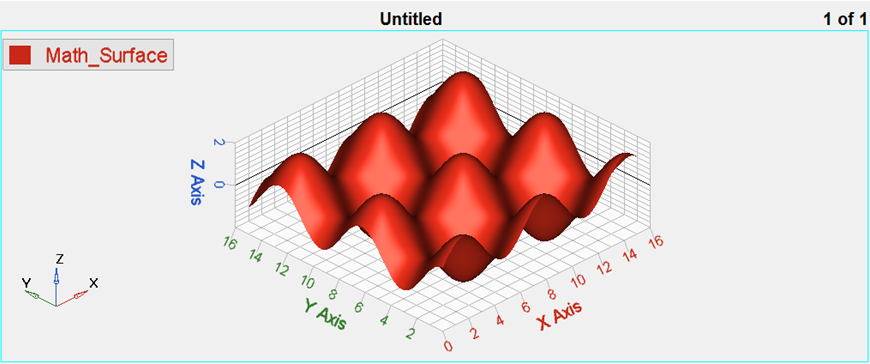
In this tutorial, you will learn how to create surface plots.
Tools
The Define Curves panel can be accessed one of the following ways:
| • | On the toolbar, click the Define Curves panel icon  |
Or
| • | From the menu bar, select Curves > Define Curves |
The Define Curves panel enables you to create new Surface plots. New data can be mathematically defined using the program's curve calculator, or entered as values.

Step 1: Creating a Surface Plot from a math expression
| 1. | From the menu bar, select File > New > Session. |
| 2. | Click on the Define Curves icon  to access the panel. to access the panel. |
| 3. | Select Surface from the pull down menu. |

| 4. | Click Add under the Surface list. A surface labeled Surface1 is added to the list. |
| 5. | In the text box rename Surface 1 as Math_Surface and press ENTER. |
The new name is now displayed in the list and in the legend.
| 6. | Verify that the Source type is set to Math. |
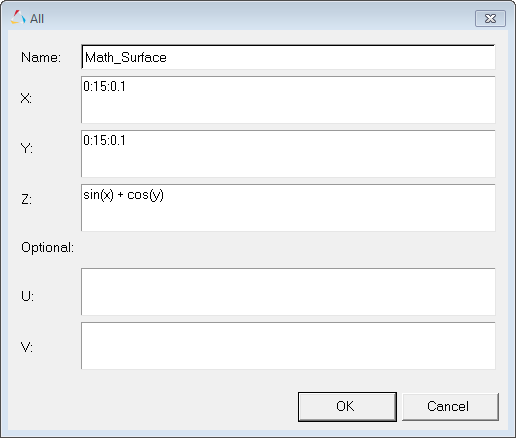
| 7. | Under Vector: click All. |
| 10. | Set Z to sin(x) + cos(y). |

| 11. | Click OK to close the window. |
| 12. | Click Apply to create the surface plot. |

Step 2: Saving the Session as session file Curve_Attributes_Surface.mvw
| 1. | From the menu bar, select File > Save As > Session. |
| 2. | Name the file as Curve_Attributes_Surface.mvw. |
Go to HyperGraph 3D Tutorials


