In this tutorial, you will learn how to create waterfall plots.
Tools
The Waterfall panel can be accessed one of the following ways:
| • | From the toolbar, click the Waterfall panel icon  |
Or
| • | From the menu bar, select Curves > Waterfall |
The Waterfall panel allows you to create waterfall plots from XY force response data and input pulses. If a waterfall plot exists in the current window, HyperGraph 3D automatically fills in the default values.
Exercise: Creating Waterfall Plots
Step 1: Open Session File trimmer.mvw and create HyperGraph 3D window
| 1. | From the menu bar, select File > Open > Session. |
| 2. | From the 3dplotting folder, select the file trimmer.mvw and click Open. |
| 3. | Click Close on the message log that appears. |
| 4. | Click on the Add Page  button to add a page. button to add a page. |
| 5. | Select HyperGraph 3D from the Select Application Menu icon. |
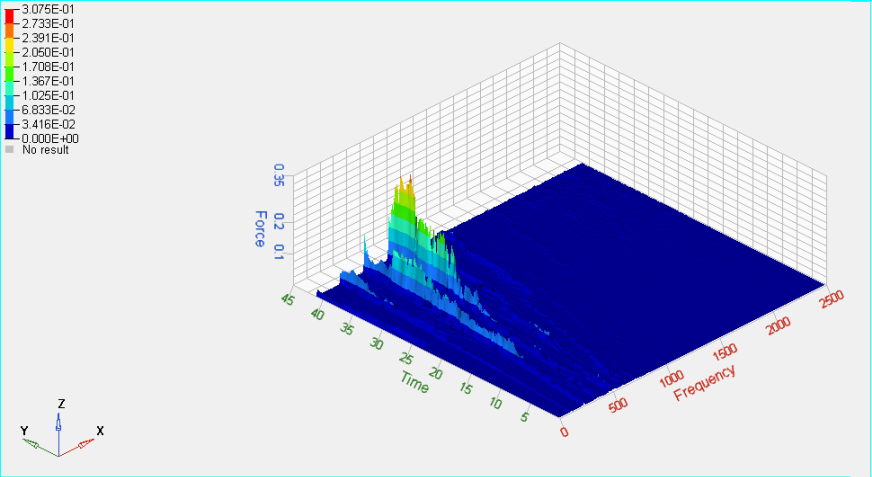
Step 2: Create a Frequency versus Time waterfall plot
| 1. | Click the Waterfall icon on the toolbar to enter the panel. |
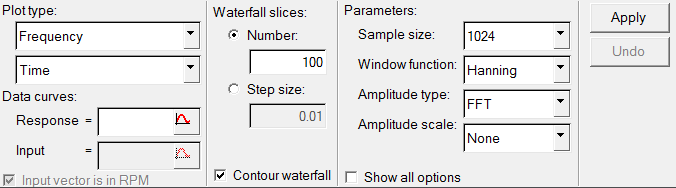
| 2. | Verify that Frequency and Time are the options set under Plot Type:. |
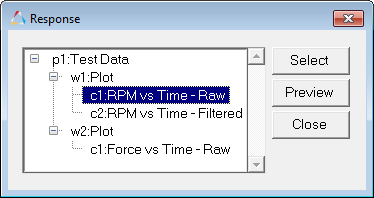
| 3. | Click the curve selection icon  in the Response Field for Data Curves:. in the Response Field for Data Curves:. |
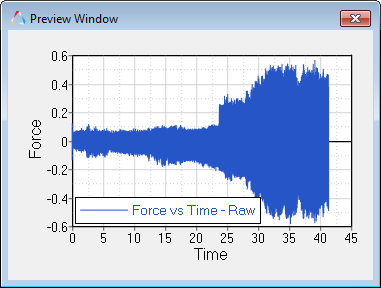
| 4. | Choose the Force vs Time - Raw curve. |
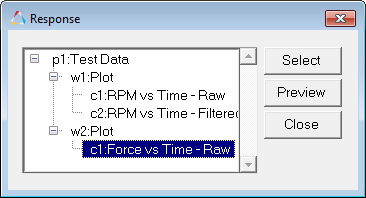
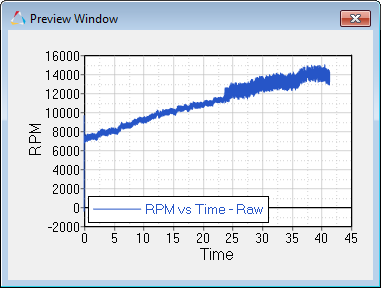
| 5. | Click Preview to view the curve. |
| 7. | Verify that the curve referenced under Response is p1w2c1. |
| 8. | Enter 100 for Number under Waterfall slices. |
| 9. | Check the Contour waterfall option. |
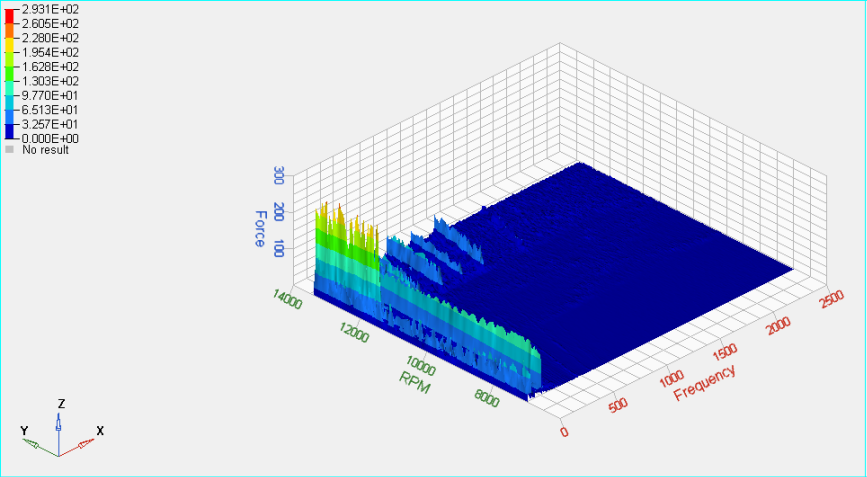
Step 3: Create a Frequency versus RPM waterfall plot
While in the Waterfall panel, do the following:
| 1. | For Plot Type: select Input Magnitude instead of Time from the pull down menu. |
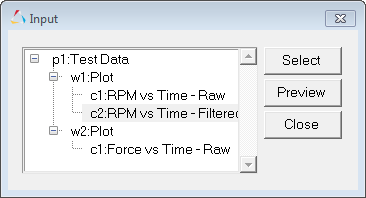
| 2. | Under Data Curves, select RPM vs Time – Raw for Response |
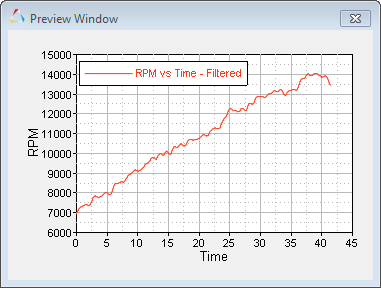
| 3. | Select RPM vs Time – Filtered for Input under Data Curves. |
| 4. | Check the box for Input vector is in RPM to scale the RPM to RPS. |
| 6. | Click Undo to return to the Frequency vs Time plot. |
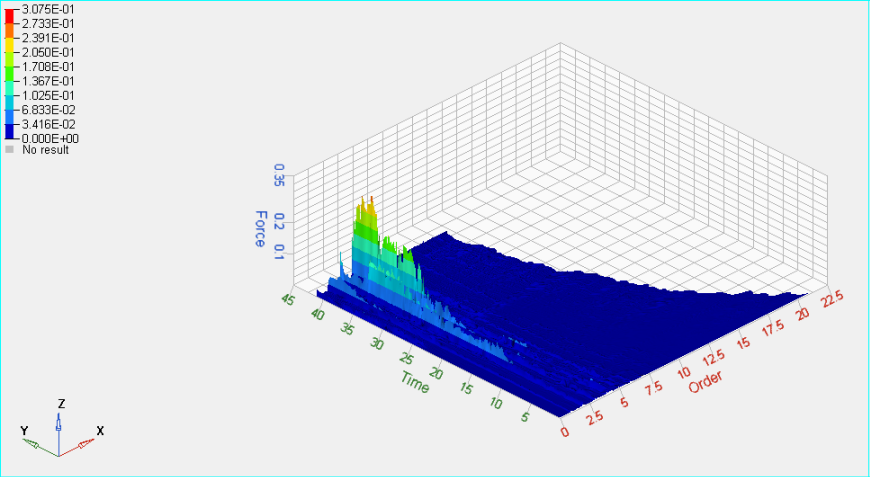
Step 4: Create an Order waterfall plot
While in the Waterfall panel, do the following:
| 1. | For Plot Type: select Order(scaled) instead of Frequency from the pull down menu. |
| 2. | Select RPM vs Time – Filtered for Input under Data Curves. |
| 3. | Click Apply to create the plot. |
| 4. | Click Undo to return to the Frequency vs Time plot. |
Go to HyperGraph 3D Tutorials


