FMVSS |

|

|

|

|
|
FMVSS |

|

|

|

|
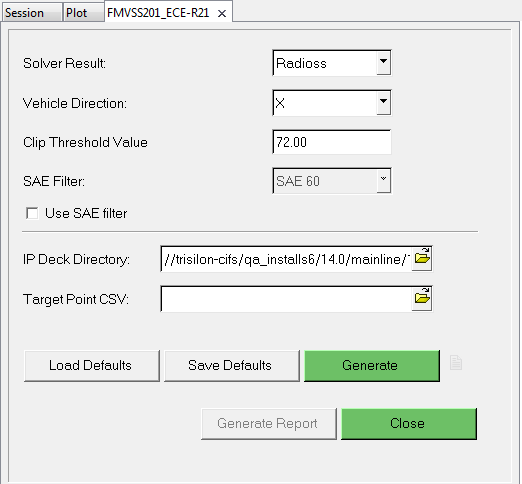
In HyperGraph 2D, select Safety Tools > FMVSS to display the FMVSS safety tool browser tab.
Note: From the Options panel, you must select Enable Unit Scaling to use this tool.

Option |
Description |
||||||||||||
|---|---|---|---|---|---|---|---|---|---|---|---|---|---|
Solver Result |
From the drop-down menu, select Radioss or LsDyna. |
||||||||||||
Vehicle Direction |
Select X or Y for the direction that you want to cut the section. |
||||||||||||
Clip Threshold Value |
Enter a clip threshold value. The maximum value is 72 |
||||||||||||
SAE Filter |
To apply an SAE filter, activate the Use SAE filter option and select one of the following SAE filters:
|
||||||||||||
IP Deck Directory |
Use the file browser, |
||||||||||||
Target Point CSV |
Select a .csv file that contains target point data. A data point table is displayed in the browser tab:
You can click on a column heading to sort the data. After the results are plotted, you can also click on a point from the Target Location column and it will go to that plot. |
||||||||||||
Mode |
Select Append, Overlay or Replace. Use Overlay to select a new point and overlay it onto an existing plot. Use Replace to replace the currently plotted data with new results. |
||||||||||||
Load Defaults |
Loads previously-saved entry options. |
||||||||||||
Save Defaults |
Saves the current entry options as the default. |
||||||||||||
Generate |
Click Generate to plot your results based on your selections. The following dialogs are displayed:
For both dialogs, once you make your selections, click Proceed to generate the plots. |
||||||||||||
Generate Report |
Upon plotting your results, click Generate Report to output your result data to a PowerPoint PPT file, which contains your project details, results table, and plot images. |
||||||||||||
Close |
Click Close to close the browser tab. |