Relative Displacement |

|

|

|

|
|
Relative Displacement |

|

|

|

|
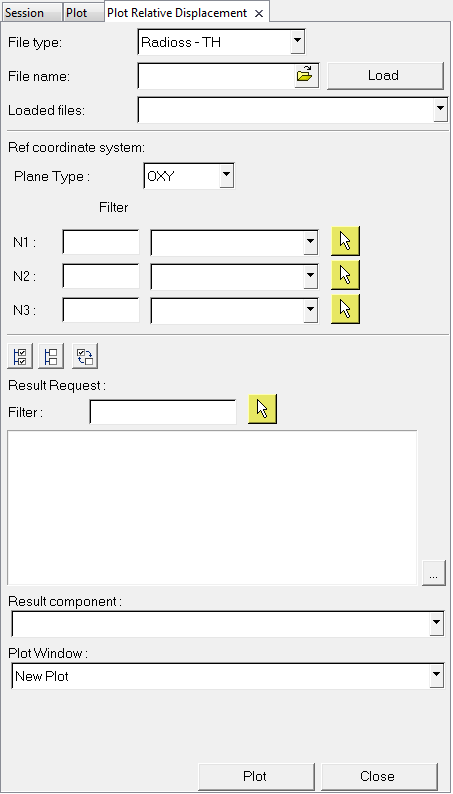
In HyperGraph 2D, select Safety Tools > Relative Displacement to display the Relative Displacement browser tab.
The Relative Displacement tool allows you to transform vector results from a time history or animation result files according to a coordinate system defined by three nodes from the same result file. This allows you to see the relative displacements in the higher sampling rate normally provided by time history results.

Option |
Description |
|||||||||
|---|---|---|---|---|---|---|---|---|---|---|
File type |
From the drop-down menu, select a file type. Supported file types include: Radioss - TH Dyna - nodout Dyna - d3plot Dyna - binout Pamcrash - THP Radioss - A001 Pamcrash - DSY Hyper 3D - H3D |
|||||||||
File name |
Once you have selected a file type, use the file browser button, The remaining fields in the browser are populated upon loading your file. |
|||||||||
Loaded files |
If you load another supported file type from the Build Plots panel, that file is also displayed on a drop-down list in this field, along with the file you loaded directly from the browser tab. If you select the file you loaded from the Build Plots panel, the results from that file are automatically populated in the Relative Displacement browser tab and you can then plot the displacement using those results. |
|||||||||
Ref coordinate system |
From the Plane Type drop-down menu, select OXY, OYZ, or OZX as your coordinate system. For N1, N2, and N3, select the reference points from the corresponding drop-down list. |
|||||||||
Filter |
Under Filter, in the N1:, N2: and N3: fields, you can enter a values to filter the options contained in the corresponding drop-down lists. For example, for N1:, if you enter "870", only the results that contain "870" in the point name are displayed. This is helpful if you have a large list of nodal points to search in the list. |
|||||||||
Result Request |
Select the point for which you want to plot the relative displacement with respect to the three points you selected in the reference coordinate system section. |
|||||||||
Filter |
Enter values to filter the result types listed below. |
|||||||||
|
Click Select All to select all items in the list. |
|||||||||
|
Click Select None to clear any existing selections. |
|||||||||
|
Click Reverse to reverse the current selections. |
|||||||||
Result component |
Select one of the following options to plot the X, Y, Z, or relative displacement type:
|
|||||||||
Plot Window |
New Plot plots your results in a new plot. Existing Plot plots your results in an existing plot. If you select this option, the Existing HG Clients in Session menu is displayed, which allows you to select the existing page and window that you want to plot your results to. |
|||||||||
Plot |
Click Plot to plot your results. |
|||||||||
Close |
Click Close to close the browser tab. |
|||||||||