The vehicle safety tools' preference file contains templates to plot IIHS front intrusion and IIHS side structure intrusion plots for RADIOSS and DYNA files. Upon loading the Vehicle Safety Tools preference file, the Safety Tools menu bar option is displayed. From the IIHS Intrusion submenu, you can select Front > Front(40%), Front > (Front(25%) or Side.

IIHS Front (40%) Intrusion plots these file types:
| • | DYNA nodout, binout and d3plot files |
IIHS Front (25%) Intrusion plots these file types:
| • | DYNA nodout, binout and d3plot files |
IIHS Side Impact Intrusion plots these file types:

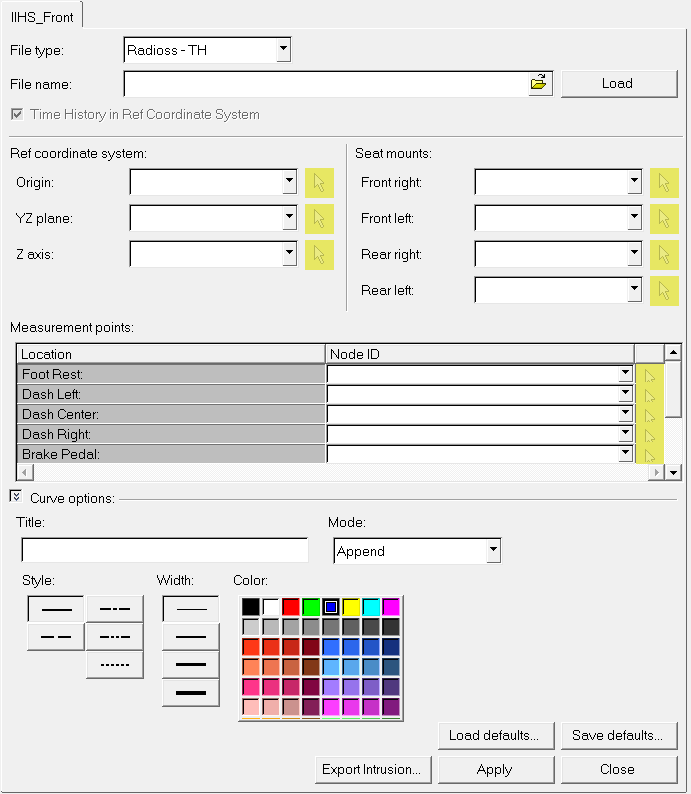
IIHS Front (40%) Intrusion dialog
|
Option
|
Description
|
File type
|
Select the solver output results file type.
Options include:
|
File name
|
Click the file browser icon to select the output result file for the selected file type.
|
Load
|
Upon clicking Load, the following action is performed based on the selected file type.
For time history files (nodout, binout, TH):
| • | Selected results file is validated for the selected file type. |
| • | All node (response location) selection drop-down fields will be filled with the response location/node available in the result file. |
For graphical result files (d3plot, H3D):
| • | Selected results file is loaded into a new HyperView page. |
|
Nodout in Ref Coordinate System
|
This option resolves displacement with respect to the local system. If displacement is resolved in the results file, then intrusion should be calculated without resolving displacement.
|
Ref Coordinate System
Seat mounts
Measurement points
Node selection
|
Under Ref Coordinate system, select nodes for the d3plot and H3D files.
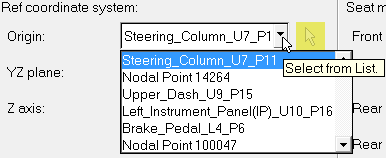
Click the arrow,  , to pick nodes from drop-down menu. For animation files, node numbers can be typed in. , to pick nodes from drop-down menu. For animation files, node numbers can be typed in.
Nodes can be selected from drop-down menu for nodout, binout, and TH files. For example:

|
Curve options
|
Allows you to edit the following curve display options:
| • | Mode – The standard modes available to plot curves. From the drop-down menu, select Append, Overlay or Replace. |
| • | Style - Select the curve line style. |
| • | Width - Select the curve line width. |
| • | Color - Select the curve line color from the palette. |
|
Load/Save defaults
|
User-specified inputs can be saved as a default file (.def) and can be loaded again for future use. Reference coordinate system points, seat mount points, measurement points and curve options are saved in the default file.
|
Export Intrusion
|
Exports the last calculated intrusion values into a text file. An exported intrusion text file can be reused later by selecting Saved intrusion data as the file type and selecting the respective file.
For plotting saved intrusion data, you can directly select the file, specify curve options and plot the graph.
|
Apply
|
Upon clicking Apply, the following steps are performed to plot the final results:
| • | Calculate intrusion for all measurement points. |
| • | Plot the intrusion plot with standard regulation limit plots. Intrusion values are also tabulated in a separate TextView window. |
|
Close
|
Closes the tool.
|
|

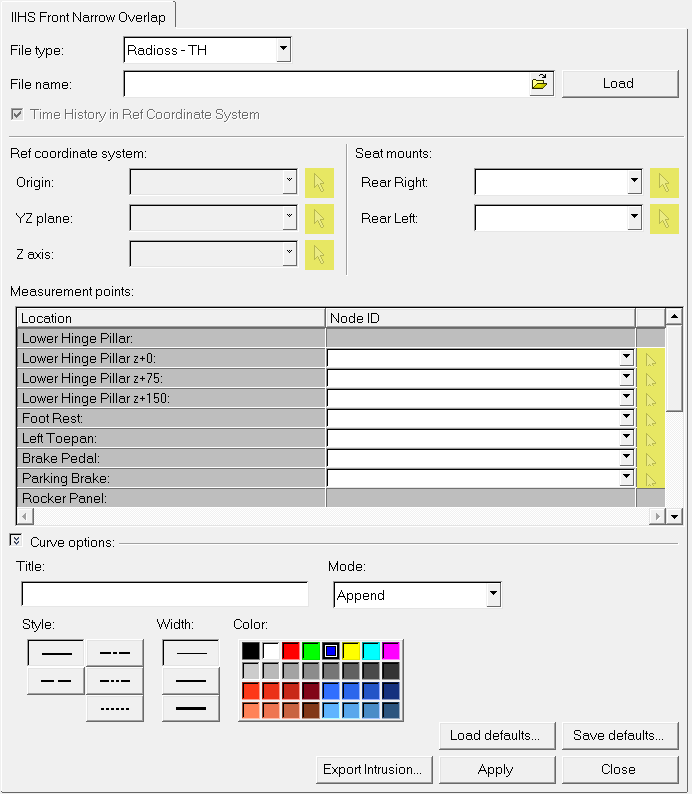
IIHS Front (25%) Intrusion
Option
|
Description
|
File type
|
Select the solver output results file type.
Options include:
|
File name
|
Click the file browser icon to select the output result file for the selected file type.
|
Load
|
Upon clicking Load, the following action is performed based on the selected file type.
For time history files (nodout, binout, TH):
| • | Selected results file is validated for the selected file type. |
| • | All node (response location) selection drop-down fields will be filled with the response location/node available in the result file. |
For graphical result files (d3plot, H3D):
| • | Selected results file is loaded into a new HyperView page. |
|
Nodout in Ref Coordinate System
|
This option is disabled.
|
Ref Coordinate System
Seat mounts
Measurement points
Node selection
|
These options are disabled.
|
Curve options
|
Allows you to edit the following curve display options:
| • | Mode – The standard modes available to plot curves. From the drop-down menu, select Append, Overlay or Replace. |
| • | Style - Select the curve line style. |
| • | Width - Select the curve line width. |
| • | Color - Select the curve line color from the palette. |
|
Load/Save defaults
|
User-specified inputs can be saved as a default file (.def) and can be loaded again for future use. Reference coordinate system points, seat mount points, measurement points and curve options are saved in the default file.
|
Export Intrusion
|
Exports the last calculated intrusion values into a text file. An exported intrusion text file can be reused later by selecting Saved intrusion data as the file type and selecting the respective file.
For plotting saved intrusion data, you can directly select the file, specify curve options and plot the graph.
|
Apply
|
Upon clicking Apply, the following steps are performed to plot the final results:
| • | Calculate intrusion for all measurement points. |
| • | Plot the intrusion plot with standard regulation limit plots. Intrusion values are also tabulated in a separate TextView window. |
| • | Writes the structural Ratings for IIHS Front regulation. |
|
Close
|
Closes the tool.
|
|

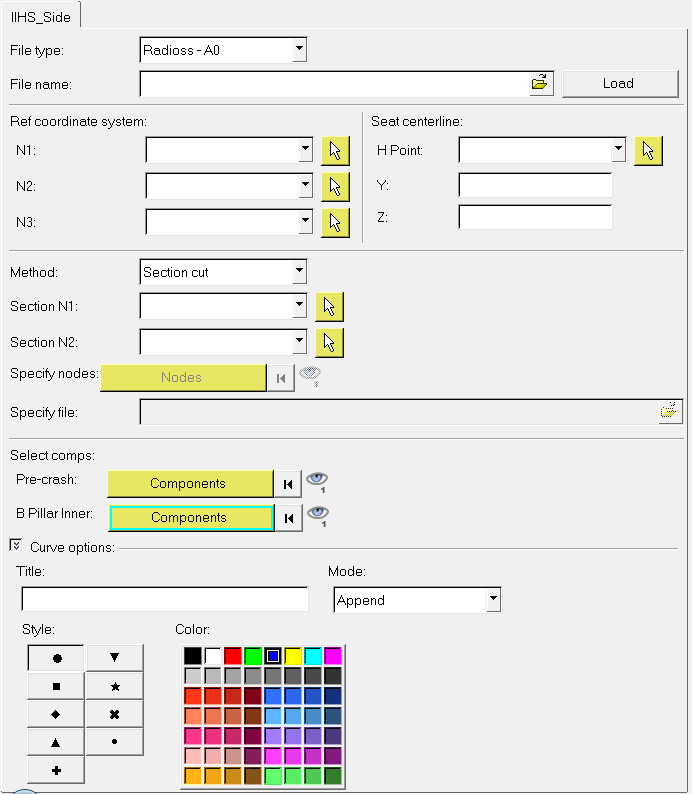
IIHS Side Impact Intrusion dialog
|
Option
|
Description
|
File type
|
Select the solver output results file type.
Options include:
|
File name
|
Click the file browser icon to select the output results file for the selected file type.
|
Load
|
Upon clicking Load, the following action is performed based on the selected file type.
For the graphical result file (d3plot, H3D):
| • | The selected results file is loaded into a new HyperView page. |
|
Ref coordinate system
Seat Centerline
|
Select nodes from the drop-down menu for the d3plot and H3D files.
Click the arrow,  , to pick nodes from the drop-down menu. , to pick nodes from the drop-down menu.
Y and Z coordinates will be used from the node selection menu. Or, you can enter the Y and Z values for the h-point.
|
Method
|
Three methods are available for picking the B-pillar profile:
| 1. | Section cut: Pick two nodes on the top and bottom of the B-pillar and the utility determines the closest node along that line. |
| 2. | Specify nodes: Graphically pick the nodes on the screen. |
| 3. | Specify file: If node definitions have been saved in a file, you can select that file. |
|
Curve options
|
Allows you to edit the following curve display options:
| • | Title – The name of curve. |
| • | Mode – The standard modes available to plot curves. From the drop-down menu, select Append, Overlay or Replace. |
| • | Style - Select the curve line style. |
| • | Color - Select the curve line color from the palette. |
|
Load/Save defaults
|
User-specified inputs can be saved as default file (.def) and can be loaded again for future use. Reference coordinate system points, seat mount points, measurement points, and curve options are saved in the default file.
|
Export Intrusion
|
Exports the last calculated intrusion values into text file. An exported intrusion text file can be reused later by selecting Saved intrusion data as the file type and selecting the respective file.
For plotting saved intrusion data, you can directly select the file, specify curve options and plot the graph.
|
Apply
|
Upon clicking Apply, the following steps are performed to plot the final results.
| • | Calculate intrusion for all measurement points. |
| • | Plot the intrusion plot with standard regulation limit plots. Intrusion values are also tabulated in a separate TextView window. |
|
Close
|
Closes the tool.
|
|
See Also:
Vehicle Safety Tools


