Pedestrian Impact |

|

|

|

|
|
Pedestrian Impact |

|

|

|

|
The Pedestrian Impact tool generates a deck for the simulation of the pedestrian head impact on vehicle hoods and windshields. It also creates PowerPoint (PPT) and Excel reports. This tool takes graph files as input and plots the results per GTR or Euro NCAP regulation for the selected impactor type. It has two modes:
| • | Auto Report Generation |
| • | Interactive Section |
The Pedestrian Impact tool conforms to the pedestrian safety regulations GTR, EuroNCAP and Homologation. Pedestrian Impact automates the process with minimal input from you, therefore reducing the deck generation lead time with less human error. Pedestrian Impact is available in the Crash LS-DYNA and RADIOSS user profiles in Engineering Solutions. Click here for more information on using Pedestrian Impact in Engineering Solutions.
Once you have created your deck in Engineering Solutions, you can load your results into the HyperGraph 2D Pedestrian Impact Browser to generate an Excel report that contains all the curves available (acceleration of the head, maximum displacement of the bonnet) for each point of the bonnet. It also contains the images of the different contours (HIC, maximum displacement, and time of maximum displacement).
From the Pedestrian Impact Browser, you can also view contours of your HIC and capture the image for later use.
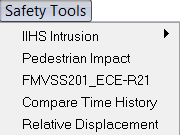
In HyperGraph 2D, select Safety Tools > Pedestrian Impact to display the Pedestrian Impact browser.


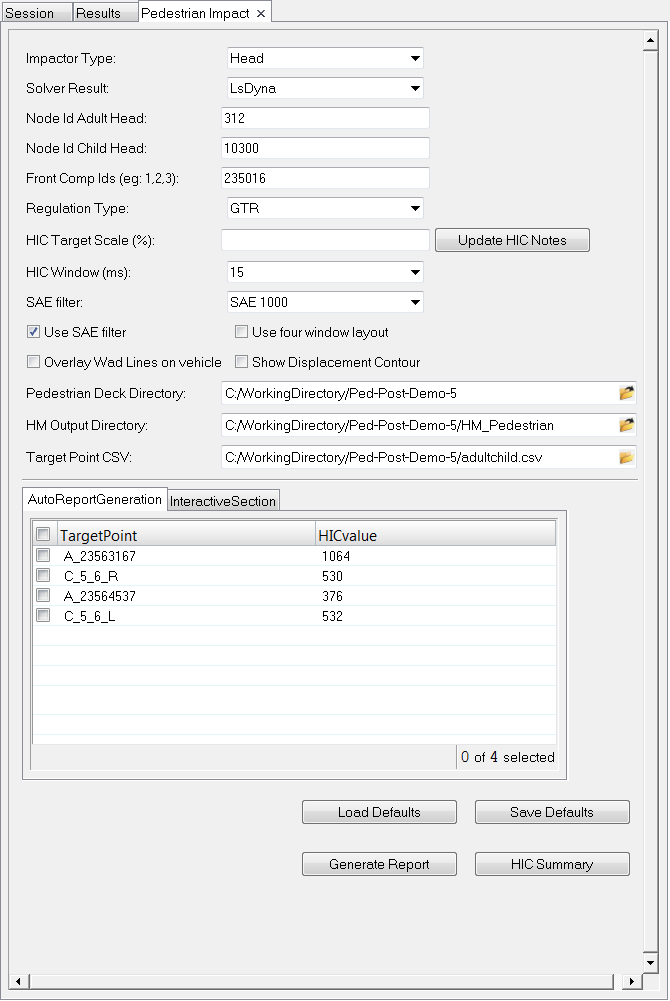
Pedestrian Impact browser
The following options are available:
Option |
Description |
|||||||||||||
|---|---|---|---|---|---|---|---|---|---|---|---|---|---|---|
Impactor Type |
From the drop-down menu, select Head, Upper Leg, or Lower Leg. If you select Head as the Impactor Type, you can specify the following: |
|||||||||||||
Node Id Adult Head |
The ID used for the section cut in the model. |
|||||||||||||
Node Id Child Head |
The ID used for the section cut in the model. |
|||||||||||||
Front Comp Ids (e.g: 1, 2, 3) |
The ID used for the front components in the model. |
|||||||||||||
Regulation Type |
Choose either GTR or EuroNCAP. |
|||||||||||||
HIC Target Scale (%) |
This value scales the target values for the regulation. For example, a value of 20% will scale down the 1000 HIC value, which is green for GTR, to 800. The HIC note updates the color accordingly. Note The actual HIC value from the simulation is not changed. This percentage can be considered a safety margin. Updated HIC notes will trigger the value that is used and displayed in the graphics. |
|||||||||||||
HIC Window (ms) |
Duration for the HIC calculation in milliseconds. |
|||||||||||||
SAE Filter |
Graph smoothing can be achieved by selection one of the following SAE filters:
|
|||||||||||||
The above options are NOT available if you select Upper Leg or Lower Leg as the Impactor Type. |
||||||||||||||
Solver Result |
From the drop-down menu, select RADIOSS or LsDyna for the solver type. |
|||||||||||||
Update HIC Notes |
See the HIC Target Scale definition above. |
|||||||||||||
Plotting Options |
Select any of the following options to customize your results display.
These options are NOT available if you select Upper Leg or Lower Leg as the Impactor Type. |
|||||||||||||
Auto Report Generation |
For report generation, the Pedestrian Deck Directory, HM Output Directory and Target Point CSV file locations are required.
From the file browser, select the Pedestrian Decks Directory (the location where the pedestrian decks are solved). In this directory, there are sub-directories that contain the respective result files. All the sub-directories and result files should be named in a standard format. For example, the first two or three letters of these names should be “CL_”, “CR_”, “AL_”, “AR_”, “C_0”, “A_0” or “N_”. The image below shows the structure of the selected directory.
The HV_Output directory is created after the template is executed. This directory contains all the files generated by this tool. PowerPoint (PPT) reports are present in this directory. These files are named based on the impactor selected. PPT report’s names are:
To open the PPT reports, use PowerPoint to open the required .htm file.
Use the file browser to select the HM Output directory (the location where the WAD Line component collector is exported). This is used to create the hard part distance contour and the WAD line overlay.
For Target Point CSV, click on the file browser to select a CSV file to import. |
|||||||||||||
Interactive Section |
See the Interactive Section heading below. |
|||||||||||||
Load Defaults |
Loads previously-saved selected options. |
|||||||||||||
Save Defaults |
Saves the options currently selected. |
|||||||||||||
Generate Report |
Generates the pedestrian impact report. The table in the Interactive Section of the Browser is populated with the Pedestrian Deck data. |
|||||||||||||
HIC Summary |
This creates a HIC map of all points without loading any animation files or creating a report. The time history files are used to calculate HIC and show a map of HIC points on the hood quickly. A CSV file is written with the name HicSummary.csv. You can continue to create the report by clicking the Generate Report option. When the same default file loads the next time and if a HicSummary.csv file exists in the folder, then you will be prompted with an option to use the values without processing the data again. |
|||||||||||||
The following dialog is displayed to select the Y-Type, Y-Request and Y-Component. The options available depend on the Impactor Type that you select. If both Adult and Child points exist in the target CSV file, then there will be two prompts to select adult and child.
|
Based on the selected impactor type, a table is inserted in the Interactive Section tab. Hyperlinks in the table allow you to click on a table cell to display the data in the GUI. The table content changes per the selected impactor type: Head, Upper Leg, or Lower Leg.
|
|
The data is populated in the browser.
|