Properties Table |

|

|

|

|
|
Properties Table |

|

|

|

|
When a plot entity is selected from the plot browser tree, its properties and values are displayed in the Properties Table. The fields displayed in the Properties Table are dependent on the curve or entity type selected from the plot browser tree.
See the Plot Browser Views topic for more information on the properties displayed for each plot entity selected.
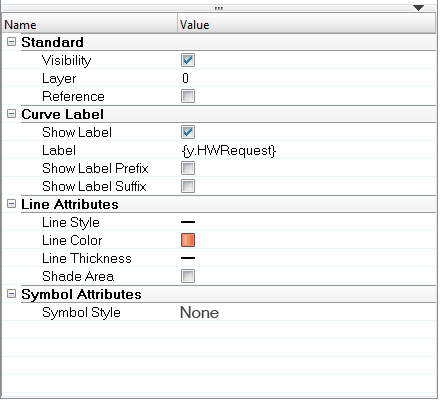
The image below shows the property information for a curve selected from the plot browser tree. Notice how the curve data is grouped by category, such as Standard, Curve Label, Line Attributes, and Symbol Attributes. Each category can be expanded/collapsed to display or hide the properties contained in it.

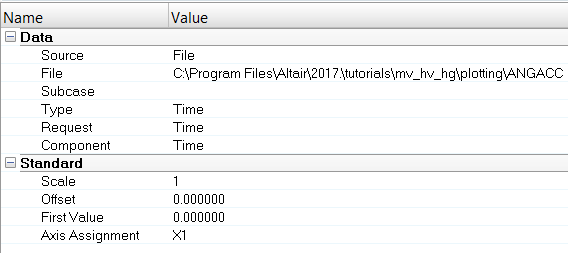
Below is an example of the Properties Table when a vector is selected from the Plot Browser tree.

The Properties Table contains two columns:
| • | Name - the name of the property. |
| • | Value - the value of the property, which can be modified when the row is clicked (enabling the edit mode). |
From the Plot Browser tree, you can select multiple curves of different types (for example, an XY curve and a bar plot), but only the properties that the curves have in common are displayed in the Properties Table. If they do not have a value in common, the Properties Table displays "###" for that field. You cannot select entities of different types (for example, a note and a legend).
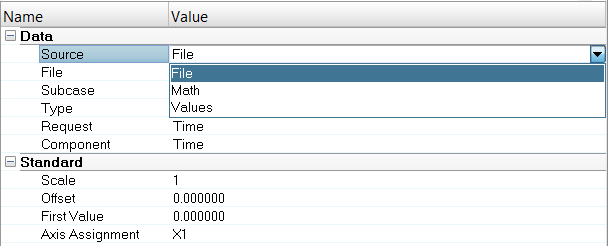
From the Properties Table, you can click on a value to edit the property instead of using the panel to edit it. For example, you can double-click in a row and a drop-down menu is displayed. From this menu, you can select a new property value:

Or, you can double-click on a value to display a dialog that allows you to edit the property's values.

You can also double-click on a value to enter a new value directly into the row, ![]() .
.
See Also: