Many factors can be a source for variations in design parameters changing the nature of a design problem from deterministic to probabilistic. These factors can be due to:
Physical uncertainty:
| • | Boundary and initial conditions |
Numerical simulation uncertainty:
Manufacturing:
| • | Random design (controlled) variables |
Loads:
| • | Random noise (uncontrolled) variables |
Material data:
| • | Random noise or input variables |
Uncertainties listed above can affect input variables, also called controlled parameters, such as thickness, stiffness. They can also affect design parameters, also called uncontrolled or noise parameters, such as temperature, humidity. The resulting variations in these parameters are usually modeled by one of the many probability distribution functions based on their nature. In HyperStudy, normal, uniform, weibull, triangular and exponential distributions are available. Details of these will be covered in the next sections.
Corresponding to the variations in controlled or uncontrolled parameters, the design performance will also have variations as illustrated in Fig. 1. In this figure probabilistic characteristics of both the parameter types and output response are shown with a typical probability density function, PDF, curve. PDF curve is a plot of variable values and corresponding probabilities. PDF describes the range of values that a probabilistic variable can attain along with the occurrence probability of each value.
The objective in probabilistic design is to reduce the effects of probabilistic characteristics of design parameters onto design performance. Generally these effects are grouped as:
In engineering, reliability is the ability of a system or component to perform its required functions under stated conditions for a specified period of time. It is often reported in terms of a probability. During the design process, one of the requirements can be a minimum level of reliability on a design specification such as the probability of strength values to be greater than stress values have to be greater than Po; i.e. 95%; meaning that the design have to be at least 95% reliable with respect to strength requirements.
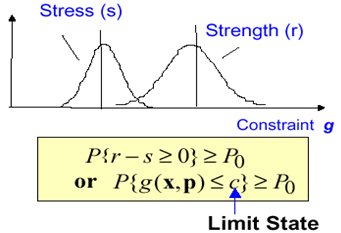
Figure 1: Example for Reliability
In Fig. 2, two PDF curves are given. The PDF in solid corresponds to a design with a large area under its curve on the right curve tail violating the g constraint. In order to increase the reliability of this performance, this area needs to be reduced; meaning possible number of failures needs to be reduced. This can be achieved by shifting the mean of performance away from the constraint. The dotted PDF corresponds to such a design and it can be seen that the area under the curve in the infeasible area is much smaller than the previous one.
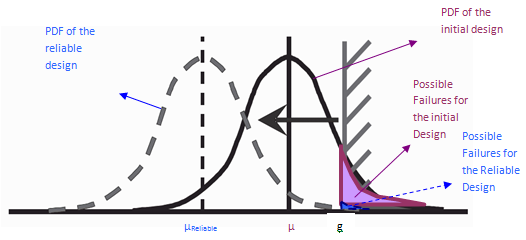
Figure 2: Improving Reliability of a Performance
|
A system or design is said to be "robust" if it has minimal change of performance when subjected to variations in its design; i.e. its performance is consistent within the variations.
Robustness of a product can be improved by shrinking the “variation of performance”.
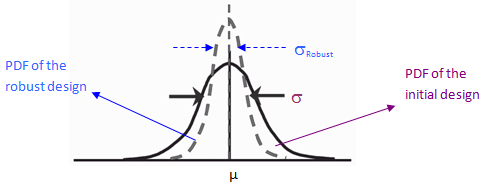
Figure 3: Improving Robustness of a Performance
|
Simultaneously shifting the mean of performance and shrinking the variation of performance, leads to both reliability and robustness improvement.
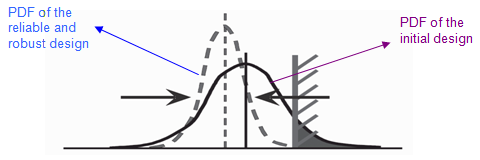
Figure 4: Improving Reliability and Robustness Simultaneously
|
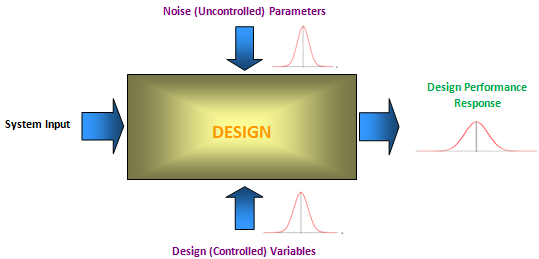
Figure 5: Uncertainty in Design


