Midside Node Results for ANSYS Output Files |

|

|

|

|
|
Midside Node Results for ANSYS Output Files |

|

|

|

|
HyperView 11.0 supports midside node results. It calculates midside node results for stress and strain tensors even though result output files do not have midside nodes.
ANSYS output files [RST, RTH, RMG] do not have results at midside nodes for tensors.
Results at midside nodes provide much more accurate prediction of results.Contour plots with midside node results predict correct simulation of a system. Refer to the examples below:

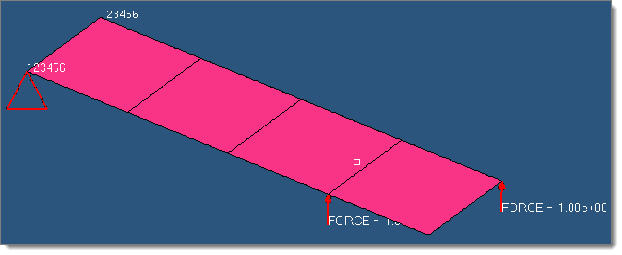
Fig 1: Model with loads and boundary conditions

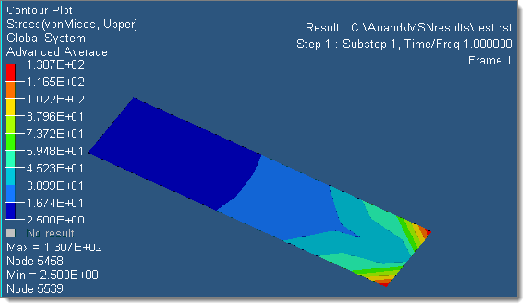
Fig 2: Stress plot with results at midside (HyperView 9.0 and later)

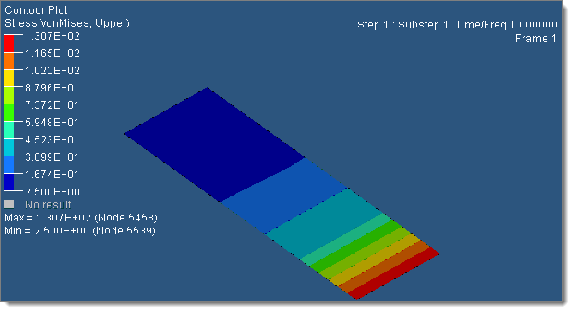
Fig 3: Stress plot without results at midside nodes (HyperView 8.0 and previous versions)
You can see that the load pattern shown in figure 1 – Stress plot with results at mid side node - shows the correct pattern of results.

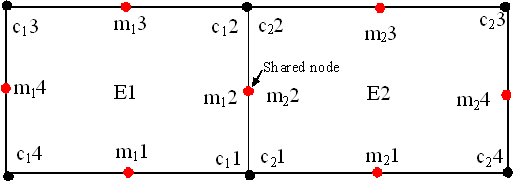
| • | Results at midside nodes are the average of corner results. |
Example at m11 =[c11+c14]/2; m21 =[ c21+c24]/2
| • | Values at midside nodes are averaged at tensor components level. Secondary results are then calculated from these component tensors at the midnodes. Secondary stresses/strains at midside nodes are not average of secondary stress/strains at corner nodes. |
| • | With “average options”, values at midside nodes are averaged before averaging corner results. |
| • | In case of “average options”, if midside nodes are shared by 2 or more elements, then the average value will be reported at a shared node. In the image shown above, at shared node it is = [m12+m22]/2 |
| • | All post processors available commercially do not support midside nodes. |
| • | With midside node result support in HyperView, contour plots from other post processors that do not show results at midside node may not match. |
| • | Legends for contours, maximum and minimum values may not match as results at mid side nodes are considered for legends and maximum and minimum values. |
What should match?
| • | If you are comparing with post processor that does not support mid side node results, individual corner result should match, for average and non average options. |