Highlights
The 14.0 release allows users to import and analyze data more quickly than previous versions. The Inspect mode enables quick data mining for a huge number of curves, Plot Browser enhancements such as filter support for all entities will speed up the editing of multiple entities at once, and features like Summary Tables Using Report Overlay will make tedious hand-editing of summary tables obsolete.
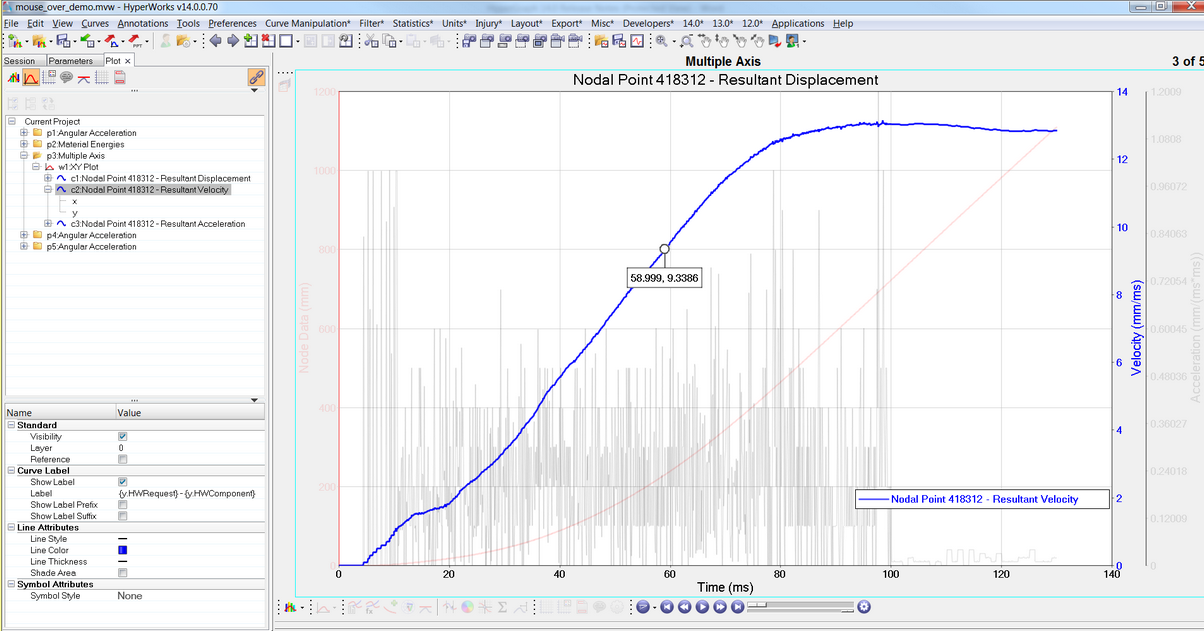
HyperGraph contains enhanced functionality for displaying and analyzing even a large number of curves, thereby improving a curve's visibility and usability. Inspect mode, which increases the screen area of the plot, is triggered via double-click. In this mode, single curves can be highlighted by fading out all other curves both in the graphics area and in the legend, and data point markers can be shown on the pre-highlighted curves when the mouse pointer moves over them. Similarly, notes can be displayed as a symbol and pop-up at mouse-over, which allows for the visualization of many notes in a small area. Pre-highlighting of all plot entities is also supported, including the highlighting of entities in non-active windows. For plots with multiple axes, only the axes associated with the highlighted curves will be shown.
|
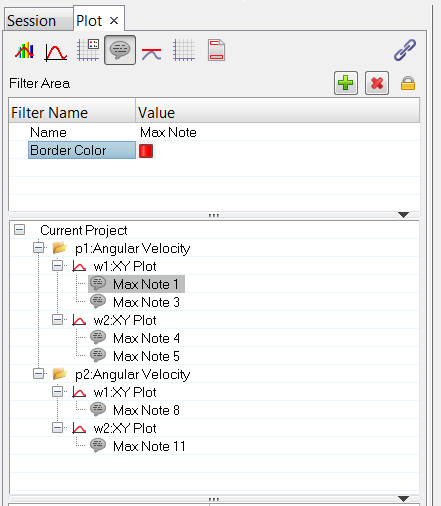
The Plot Browser now supports filtering in all Plot Browser Views for all HyperGraph entities. In previous versions, filtering was only possible for curves and vectors in the Curve View; now filters for axes, notes, legends, headers, footers, and datum lines in the corresponding views can be added. Adding filters via the property tables using the right mouse button makes it fast and easy to filter for every entity property.
|
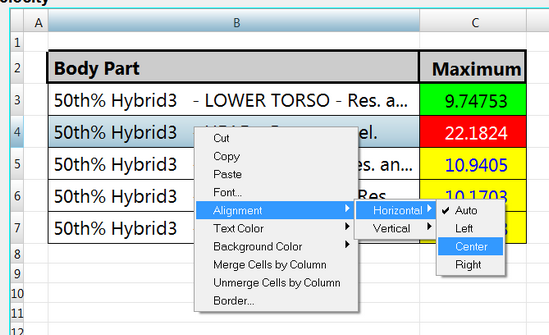
Multiple layout enhancements to TableView come with this build. The default table size is increased and cells can be merged and split over columns. Text alignment, both horizontal and vertical, is now possible, and the border thickness can be controlled. Cut, copy and paste from and to Excel is now supported, in addition to the export and import of Excel *.csv files.
|
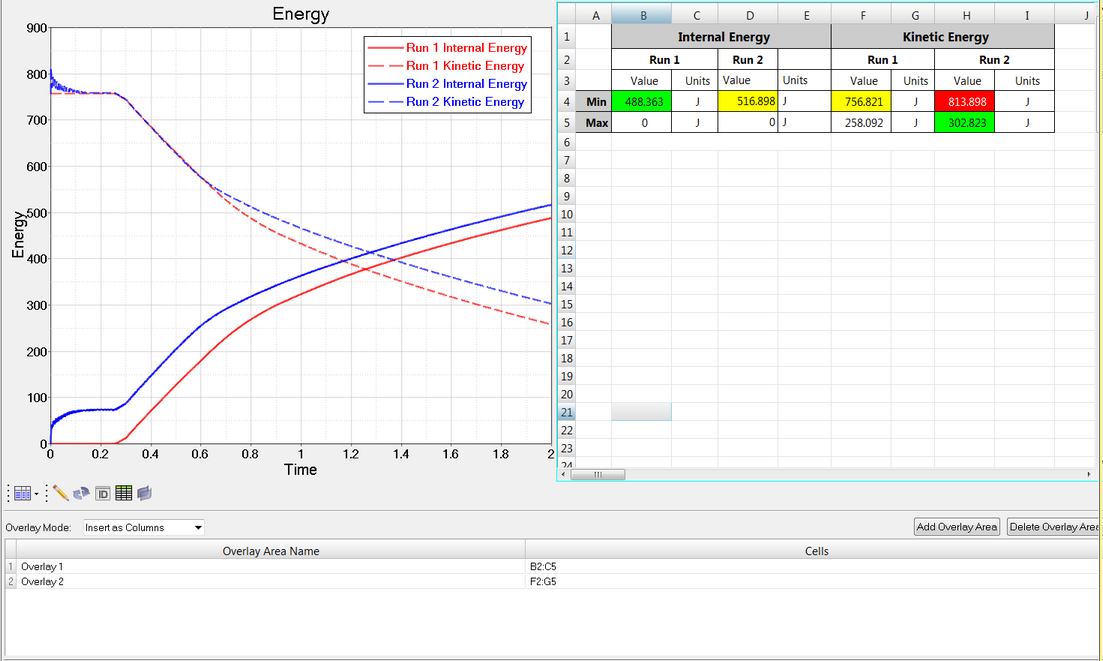
This new feature can replace customized solutions which are designed to create summary tables for overlaid reports. Two methods can be used to overlay tables: appending rows/columns or inserting (interlacing/alternating) rows/columns. “Append” mode will append whole rows or columns to the table, as part of one single overlay area, every time a report is overlaid. “Interlace” mode allows the user to define multiple interlace areas which will be inserted in such a way that results of the same type can be seen side by side, e.g. the summary table will show first the head acceleration values side by side, then the chest intrusion side by side, for all overlaid runs in a crash evaluation. Header cells which are above these areas will be expanded.
|
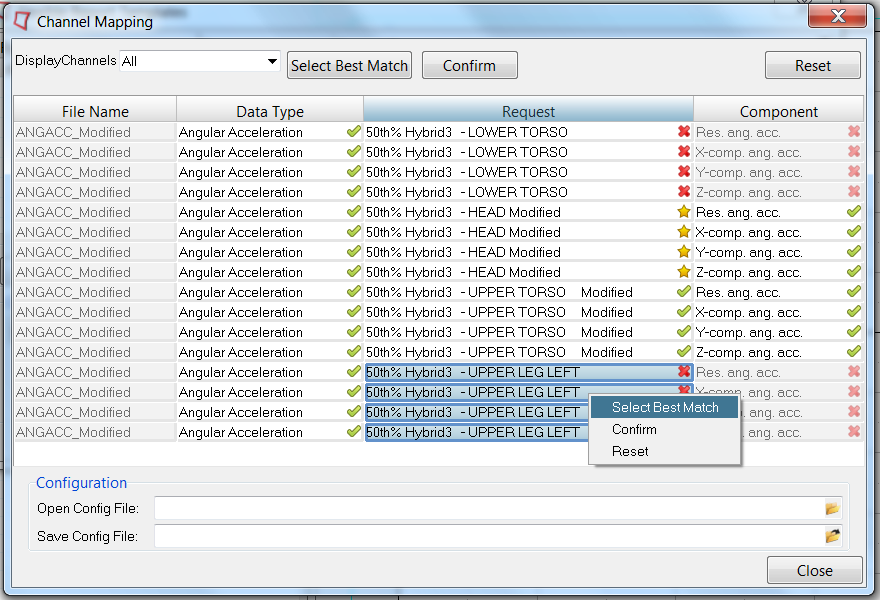
This feature allows the user to search for the best curve channel match based on the Type, Request and Component names when curve channels are not available in the selected result files. A typical use-case would be if the user wants to use a report template for only slightly different channel names, e.g. for driver and co-driver in crash test data. The results are sorted using a string match to the shortest distance, and the user can confirm and edit the search results before the report will be applied.
|
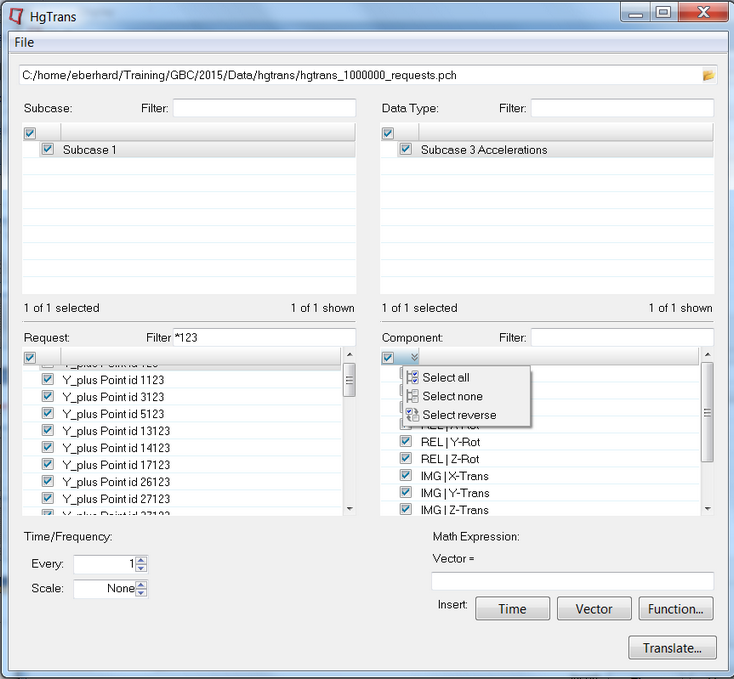
HgTrans now supports improved filtering which allows for the handling of large files with huge request lists via a GUI which has a modern look and feel. Filtering using wildcards allows much more detailed filter strings, and the user is warned before a filter string which would return such a huge list, therefore slowing down the interactive workflow, is applied.
|
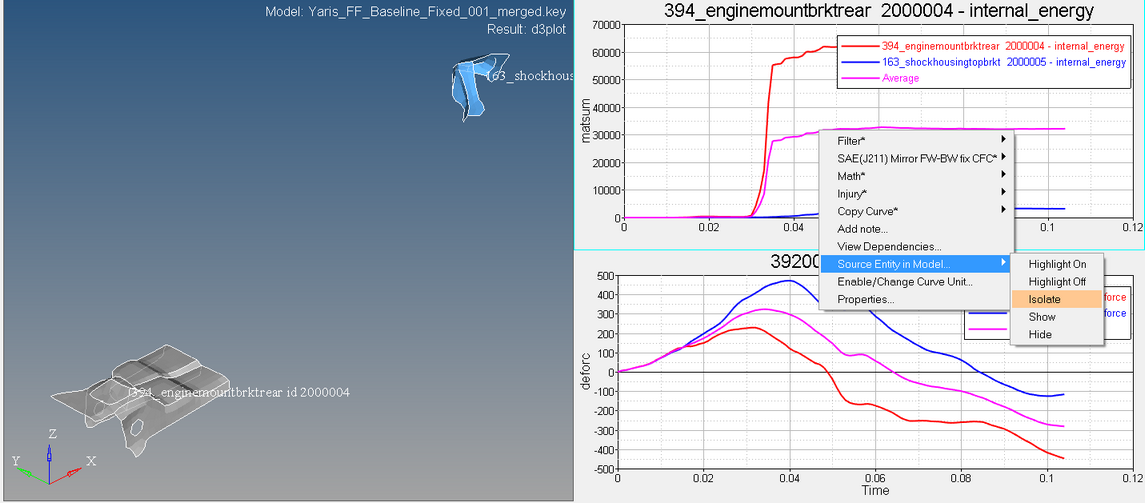
If one or more HyperView windows are open on the same page as a HyperGraph 2D window and the user selects “Highlight Source Entity in Model” from the context-sensitive curve menu, the referenced node, element or component will be highlighted in HyperView. Using the “Isolate” option will show only the components which contains the respective entities. This will also work for math reference curves which refer to multiple result curves of multiple entities. This feature is supported for LS-Dyna only.
|
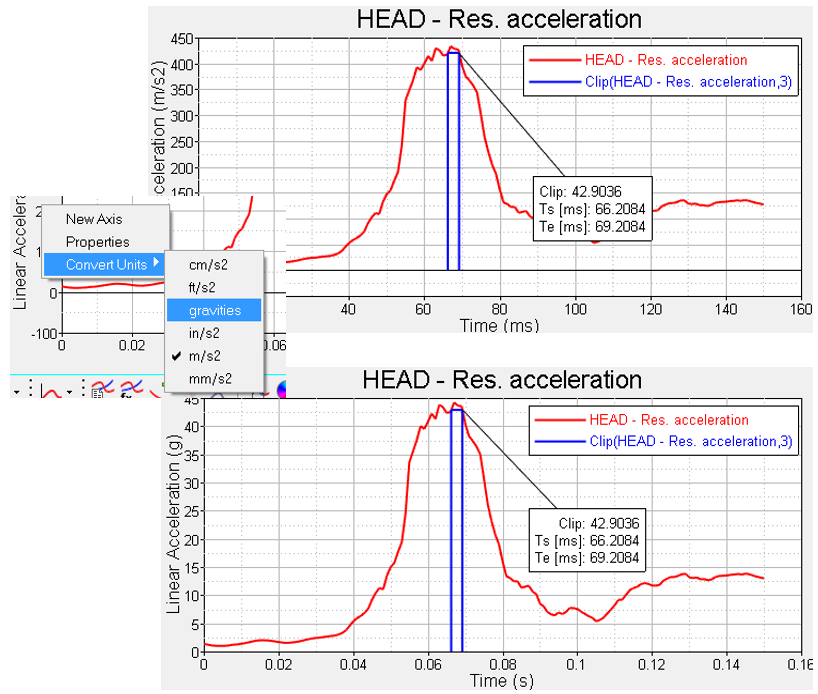
The enabling of Unit Scaling for math functions allows to the user change the axis units without the need to change scale factors in vectors or math expressions in notes. The unit scaling converts the input as required by the function and synchronizes the output units with the input units. This is supported for injury and trig functions; the related Vehicle Safety Tools macros are adapted automatically if Unit Scaling is enabled. Preference file statements are available to support unit scaling for customized functions as well.
|
New math functions are added:
| • | OLC++ : Calculates both the Occupant Load Criteria (OLC) and OLC++ |
| • | Sliding Mean Integral: Smooth’s the curve using the integral of a sliding window |
| • | Relative Displacement: Removes rigid body motion from time history results. Supported Solvers: RADIOSS, LS-Dyna, PamCrash |
| • | Logarithmic interpolation of curves where one or both axes have a logarithmic scale |
|
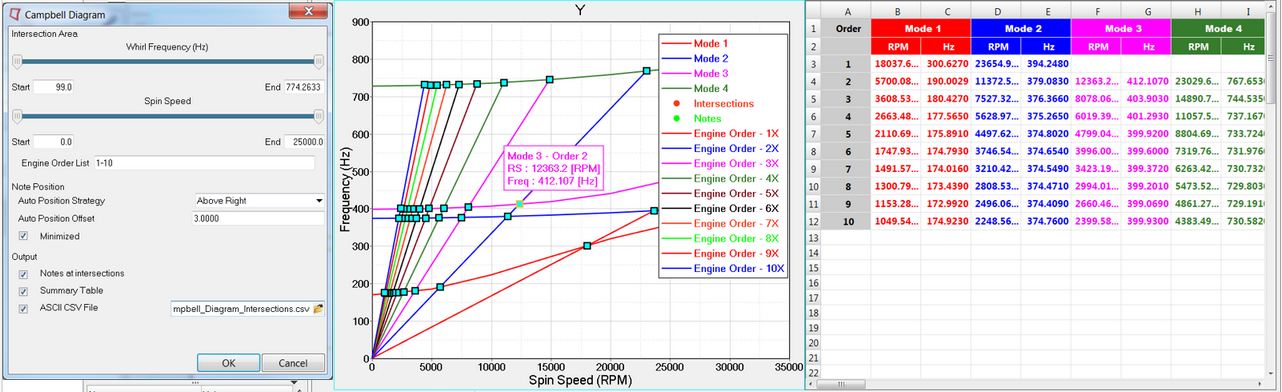
Campbell Diagrams illustrate the dependency of the Eigen frequencies on the rotation rates. The user can define, in a separate GUI, the intersection area, the engine order list for full or half orders and the layout of the required output. Summary tables can be displayed in the TableView client and exported in CSV format. Notes at intersections can be displayed in minimized mode so that the information for each only appears when the mouse pointer hovers over the note’s symbol.
|
| • | PCH Reader: Improved support of subcases for faster selection in the Build Plots panel. |
| • | Nastran NX: New reader for NVH post-processing of f06 files. |
| • | LS-Dyna: Request names will show only NAME and not NAME_ID by default. |
| • | RADIOSS: CLUSTER data support is enabled in HyperGraph readers. |
| • | RADIOSS: Unit support has been added for T01 files. |
| • | PAMCRASH: Support of ERFH, HDF5 and THP files for PAMCRASH-2014. |
|
| • | All horizontal and vertical axes can be (un-)frozen at the window level, by using the new Axis frozen property. |
| • | The Buttterworth filter function has been updated with an optional argument to reduce the ringing on both ends of the filtered curve. |
| • | Nij function now supports Out-Of-Position for 5% dummies. |
| • | File type *.hgdata has been added to the file browser in the Build Plots panel. |
| • | The file browser list in Multiple Files has been made self-adjusting so that it can incorporate long path names. |
| • | A new Templex function, getcwd(), returns the current working directory. |
| • | A new Templex function, setreaderversion(), allows the user to set to set the HyperGraph reader version from within a Templex input file. |
| • | The file filter in browsers (such as the Build Plots browser and the Define Curves browser) will now be saved on Linux. |
|
| • | Deleting pages with curves referenced in curves from type math on other pages no longer saved these curves with corrupt math references in a session file. |
| • | The default limit for the number of lines supported by the hgtextcolumn.exe reader that reads multiple formats of ASCII is set from 200,000 to 400,000 lines. |
| • | Positioning notes in the plotting client via the Tcl command “notehandle SetPosition” works now as expected, the upper left note corner are positioned to the closest pixel defined by the axis coordinates given to the command. |
| • | The performance problems overlaying reports with hundreds of pages and multiple curves per page from H3D files are fixed. |
| • | The performance reading big LS-Dyna binout files is no longer affected if this binout files contain a large amount of meta-data. |
| • | HyperGraph notes that contain text longer than the plot graphic area can now be positioned using the mouse pointer. The text alignment works as expected. |
| • | Curves from legacy files that were trimmed using the start- and end-index feature during the import failed in 13.0.110. In 14.0 they will be trimmed as expected. |
| • | The support of element type 33 was added to the pch-file reader. In 13.0.110 the import of files containing results from this element type failed. |
| • | Pch-files with more than 10,000,000 lines can now be imported into HyperGraph 14.0. They failed in 13.0.110. |
| • | The ISO-MME reader failed on Linus in previous versions if the channel names in the files and on the channel files where different considering case-sensitivity. This issue is fixed. |
| • | Trimming curves during import using Advanced Options with Start- and End-Index failed for some result types, the first point was ignored. In 14.0 this will work as expected. |
| • | When notes where attached to the maximum of a curve and these curves where trimmed using the Modify Curves panel, the notes could have vanished despite fitting the plot. In 14.0 the notes only disappear when the attachment point is not in the graphics area. |
| • | Adding min- and max-notes via the context menu of the Plot browser no longer fails when the Vehicle Safety Tools are loaded. |
| • | Every time a session was loaded and saved the y position of the note changed slightly. 14.0 no longer shows this behavior. |
| • | Changing in polar plots the dB - scaling factor to a value different than one no longer changes the phase angle. |
| • | In the Define Curves panel, large integer values of curves from type value are no longer converted to scientific format which caused the loss of valid digits saving and reloading the session. |
| • | Support of result files that contain Swedish characters in the file path works in 14.0. |
| • | The precision with which the curve data will be saved in a session file is now stored in the hwsettings.xml file for permanent usage. |
| • | Notes attached to the magnitude of complex curves scaled with db20 reference values now show the y-axis values using expressions like {y} or {x} and not the vector source value as in previous versions. |
| • | Curves in complex plots based on math references expressions no longer get scaled twice using db20 reference values unequal to one. |
| • | Curve labels created by macros from VST (e.g. resultant) are now evaluated correctly and list the different source curves. |
| • | The changes made in curve names created via the Measure panel of HyperView are now saved in report templates and no longer get lost when the report was loaded. |
| • | The axis in complex plots can now be edited when the phase/magnitude positions are swapped which was not possible in previous versions. |
| • | The bug introduced in 13.0.110 that using report template some notes could be missing in the graphics area is fixed in 14.0. |
| • | HgTrans supports the selection of USERDEFINED types from Adams req files. |
| • | Notes could be placed on top of the legends, the behavior of the versions before 12.0 is restored. |
| • | The file list in the Build Plots panel shows now all the plot files used in a loaded session, independently if they were used in the panel or not. |
| • | In 14.0 the axis scaling will be preserved if the axis min/max values where calculated by a fit with curves based on math expressions using customized Templex functions. |
| • | HyperGraph 14.0 no longer crashes while exporting curves created by the HyperView Measure panel as CSV Blocks. |
| • | The stability of the ISO-MME reader has been improved to handle data types which contain metadata but no requests or components. |
| • | EXCEL csv-files created with Export Curves no longer contain empty lines at the end. |
| • | When you load a report template via a customized menu button it will load and highlight the corresponding report definition. This was broken in previous versions. |
| • | Most of the functions to vertically modify curves using the Modify Curves panel only work if the curves are strictly increasing both and x- and y-direction. The curves will now be checked and a warning will be given if the curves are not meet this requirements. |
| • | In 14.0 complex plots labels with an increased font size no longer penetrate into the graphics area. |
| • | The new subcase-based pch-file reader in 14.0 supports Panel Participation data, which fails in previous versions. |
| • | Using high integer values for axis min/max values (e.g. 8 digits node IDs on the x-axis) are no longer converted into scientific format. |
| • | HgTrans crashed in 13.0 loading op2-files. This issue is fixed. |
| • | In previous versions external functions (IPC functions) used to round off to the 6th decimal point when returning real values. In 14.0 these values will have double precision. |
| • | In 14.0 the performance of animating curves has been improved when big and/or colored cursors are selected in the Options panel. |
| • | In the Build Plots panel “X Request” pop-up dialog a filter like in the pop-up dialog of “Y Request” has been added. |
| • | In the Notes panel the field which shows the label of attached curves has been increased to show long curve labels. |
| • | The scaling error of the PSD5 function is fixed in 14.0 |
|
| • | Handling tables with more than a couple of hundred rows slows down the performance of TableView significantly. In 14.0 TableView is designed to support report summary tables and should not be used to handle tables with more than ~500 rows/columns. |
|


