Highlights
The export and sync of conditional formatted tables in PowerPoint is added to PPT Publishing, and images in PPT will keep their aspect ratio on both Windows and Linux. HyperGraph export has also been enhanced with the ISO MME format, and 2D plots can be exported in the vector-based MS-EMF (Enhanced Metafile Format).
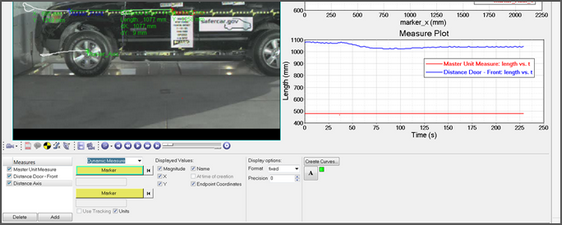
Great progress has been made in MediaView: A new pixel selector supports the redefining of markers, and a completely revamped Measures Panel allows the user to define and edit multiple measures similar to HyperView, including the curve export of dynamic distance measures between traced markers in real units. Curve values can be transformed using a tracking system defined by one or two markers.
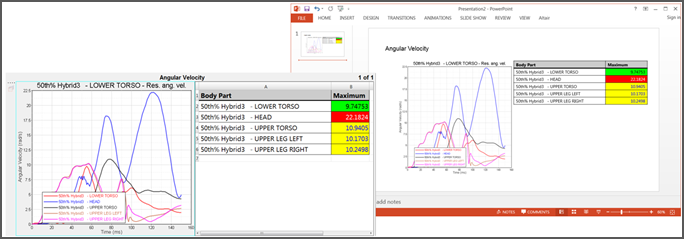
| • | TableView Support: The Publishing of TableView to PPT Tables will be supported in 14.0.110. At the initial export, the table layout in PPT will be similar to the layout in HWD. Format changes in PPT will not be overwritten when the user syncs the tables in PPT (e.g. after loading a report template with different results), however, the user has the option to specify that in addition to all cell values, the text and background colors of conditionally formatted cells will be synced. |
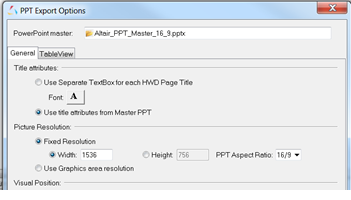
| • | Keep Aspect Ratio: The option to keep the aspect ratio of images in PPT for both the first export and when syncing new features has been implemented, dependent on the OS. Performing a live sync on Windows captures the images always dependent on the size and ratio in PPT, and images which are shrunk to thumbnail size will keep the same ratio between fonts and graphics as in full-screen mode.
In Linux, the user can define either the image height or width and the aspect ratio of the PPT master template. The PPT Publishing ensures that, for syncing, the image dimensions will be the same in PPT as long as the user uses the same settings saved by HWD at the time of the initial export. |
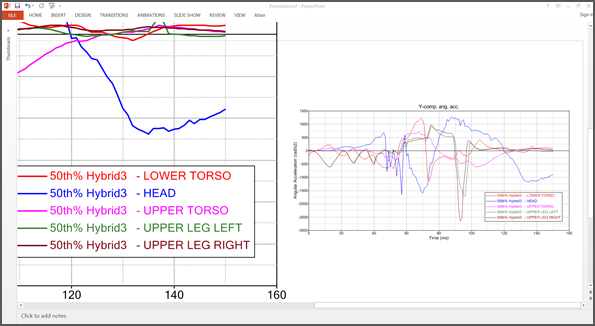
| • | EMF (Enhanced Metadata File) Support: For PPT Publishing on Windows, all 2D plotting types now support the MS EMF format. This vector-based format allows the user to resize the exported plots without losing quality, as shown in the screenshot below, where a zoomed-in section (left) of the original exported plot (right) is displayed in PPT. |
|
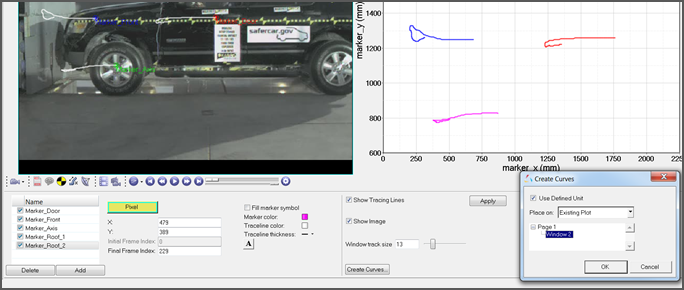
The new pixel selector allows the user to redefine the positon of markers, which provides the opportunity to use report templates for marker tracing. When a Master Unit Measure is defined in the new Measures Panel, the trace lines can be plotted in real units.
|
The completely revamped Measures panel supports multiple static or dynamic measures between markers in movies with layout options similar to HyperView. The measure values and measure curves can be displayed in real units by specifying a Master Unit Measure, which defines the conversion factor between pixels and real units. This unit definition can also be used in the curve creation feature of the Marker Tracing panel. This new functionality will make tedious manual tracing and measuring of markers in videos obsolete.
|
By creating a 2D tracking system defined by one or two markers, the positions of markers can be displayed relative to this tracking system. Features are provided to ensure that the tracking system keeps its position on the screen and that the animation will only run for the time range during which the markers defining the tracking system exist.

|
The following new features have been added to HyperGraph:
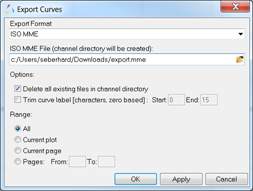
| • | The ISO MME format has been added to the curve export. |
| • | The border color of notes can be synced with the color of the attached curve. |
| • | Reverse displaying of X-axis values (from high to low) has been implemented. |
| • | The animation cursor on curve plots always visible, regardless of the active panel. |
| • | The precision of coefficients returned by the polyfit function can be defined. |
|
| • | The "fir100" math function failure on Linux has been fixed. |
| • | The issues with PSD output in LS DYNA BINOUT files has been resolved. |
| • | The PCH file reader support files which contain both DISP and SDISP results. |
| • | The frequency vectors for some PCH files are no longer imported twice, as they were in 13.0.110. |
| • | The PCH reader now supports data stored in SORT1 and SORT2 data format. |
| • | The problems loading report templates from previous versions with unit scaling enabled have been fixed. |
| • | The error message message "Vector must have same number of points… for the "saefilter"" math function no longer appears. |
| • | If the "More Colors" option in the HyperGraph 3D axes panel is used, panels can be switched without an error message. |
| • | For H3D files containing results from OptiStruct composite plies, the y request list in the Build Plots panel shows the complete list of all ply elements. |
| • | The bug with the File > Export Curves > Apply button not responding has been fixed. |
| • | The plot file check box in the Flexible Reports panel now works correctly with report templates generated by MotionSolve. |
| • | The label font size on the y axis of complex plots can now be increased without the label entering the graphics area. |
| • | Black borders no longer appear in 2D plots when all axis colors are set to white. |
|


