Analyze Data |

|

|

|

|
|
Analyze Data |

|

|

|

|
The Analyze Data tab lets you run a virtual analysis on a virtual bushing. The results of this analysis are generated in an output .spd file. The data in the output .spd file characterizes the behavior of the model in terms of the parameters, frequencies, amplitudes and preloads specified in the input .spd file(s) that you load prior to the analysis. From the Review tab, you can review the results of the analysis and compare the performance of the virtual bushing against the performance of the physical bushing.
Note: The purpose of the Analyze Data tab is to provide information to help you understand how a set of bushing coefficients performs in a virtual test. Operations on this tab are not part the fitting process.
| • | Select the Analyze Data tab. |
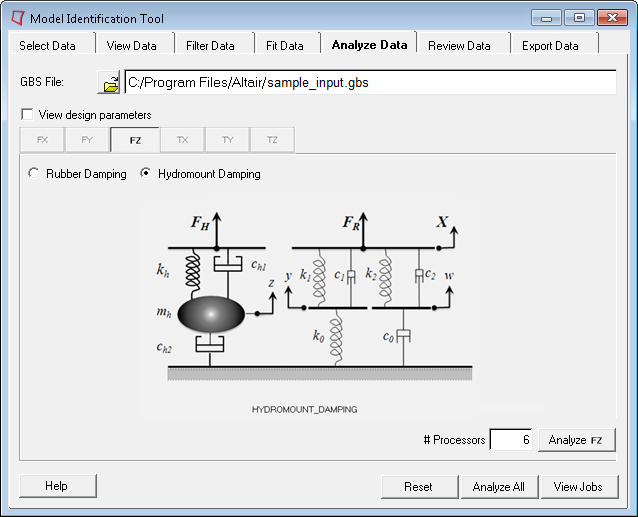
If you loaded data for a hydromount bushing, then the following page appears:

The table below describes the options unique to the Analyze Data tab. The remaining fields on the tab are the same as those on the Fit Data tab. See Fit Data for descriptions of these fields.
Option |
Description |
GBS File |
By default, this field populates with a .gbs file that is specified in the .spd file. If required, you can specify an alternative .gbs file. The .gbs file contains the bushing parameters for the fitted bushing that the Analyze algothrithm requires to initiate an analysis. By default, the software searches for a .gbs file with the same prefix as the Application_Type field specified in the .spd file. |
View design parameters |
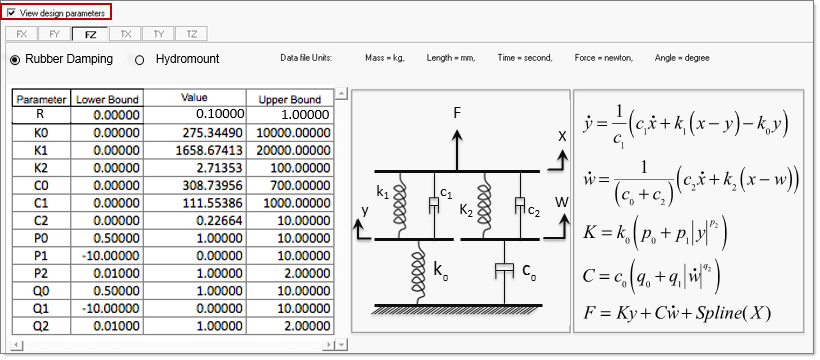
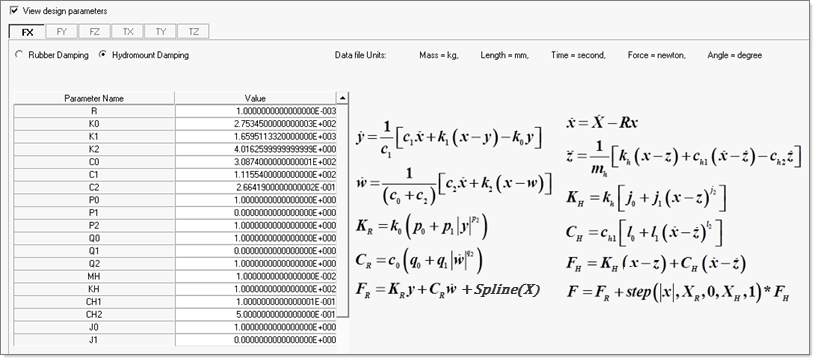
Select the View design parameters box as you see outlined in red in the following example. The model parameters and optimization settings appear so that you can view and modify these as needed. |
MIT interface with display of design parameters for a rubber bushing:

MIT interface with display of design parameters for a hydromount bushing:
