The Review Data tab lets you load, view, and plot your experiment data as described in the sections below.
| • | Select the Review Data tab, and the following page opens: |
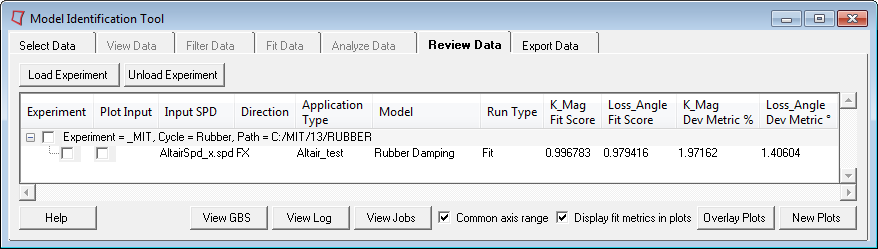
The three main functions of this tab include:
Option
|
Description
|
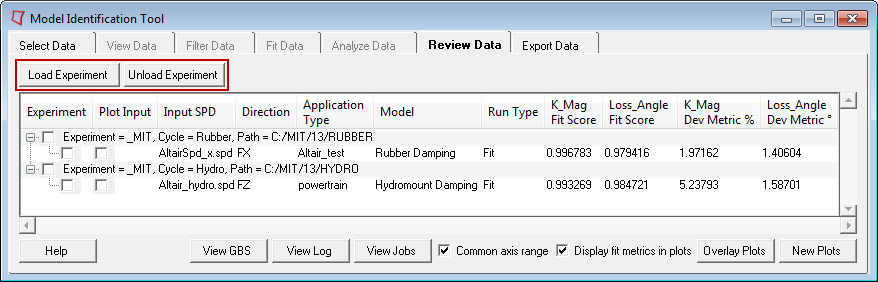
Load Experiment
|
This option prompts you to open an experiment. Afterwards, a tree populates with the directions and cycles for the experiment. MIT automatically loads experiments, directions and cycles in the tree as the fitting or analysis for individual directions is completed.
When loading your experiment, you can select from the following:
| • | Experiment Folder: Loads all cycles and directions from the experiment folder into the tree. |
| • | Cycle Folder: Loads a cycle and its related directions from the cycle folder into the tree. |
| • | Direction Folder: Loads only the selected direction into the tree.
|
|
Unload Experiment
|
To unload an experiment, find the experiment in the review tree, select its box, and then click Unload Experiment. Selecting an Experiment or Cycle recursively unloads all children from the review tree.
|
|
Option
|
Description
|
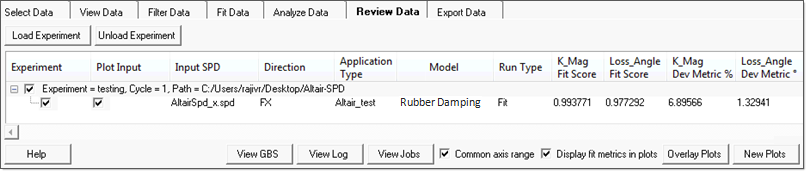
Table Tree
|
This tree lists the experiment(s) you load. The Experiment is the root node for the tree. The Experiment node can contain one or more cycles. Each cycle contains direction(s) fitted in that cycle. You can select one or more rows using the check box.
|
View and Run Options
|
View Log
|
Select View Log to display a fit.log file for a fitting operation. For an analysis operation, the analyze.log file is displayed. You can select one or more rows using the check box.
|
View GBS
|
Select View GBS to display the output .gbs file for all fitting operations. For a fit operation, input and output .gbs files are displayed side by side. For an analysis operation, only the input .gbs files are displayed.
|
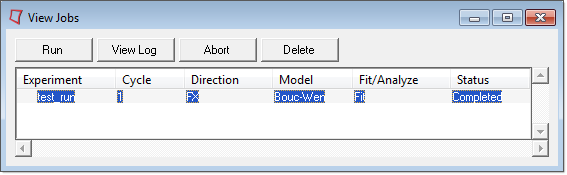
View Jobs
|
This dialog provides a summary of the runs that have been made as well as options to run, abort, and delete a selected job, or view a .log file for a selected job. New jobs are automatically added to the queued list. In case of jobs aborted due to license failure, you can add licenses and run the job(s) again by clicking Run.
To perform an operation for a job, select to highlight the row in which the job appears:
|
Run
|
Starts the execution of queued jobs. Aborted jobs can be queued for subsequent execution.
|
View Log
|
Displays the .log file for a selected job if a .log file exists.
|
Abort
|
Cancels queued job(s) or jobs in progress.
|
Delete
|
Deletes selected job(s).
|
|
MIT gives you many options to plot experiment data. To plot data, you must select the data you wish to plot along with the layout style options found at the bottom of the Review Data tab. The options for plotting data include the following:
Common Axis Range
ON
|
Select this box to apply the same axis range to all HyperGraph plots.
|
OFF
|
Select this box to apply all default HyperGraph settings.
|
Display fit metrics in plots
Overlay Plots
This option lets you overlay plots in a current HyperGraph session if the layout style (number of pages and number of windows on each page) matches with previously plotted curves. If the layout style differs, HyperGraph plots to new pages.
New Plots
This option plots curves from your selected experiments into a new HyperGraph session.
Other options and effects on plotting:
| • | Select an Experiment on the review table tree: This method plots all cycles under the selected experiment using the layout that was selected for those cycles during the Fit/Analyze process. |
| • | Select a Cycle on the review table tree: This method plots all directions in a selected cycle using the layout that was selected during the Fit/Analyze process. |
| • | Select the Direction check box on the review tree: This method plots curves of a selected direction using the layout that was selected during the Fit/Analyze process. |
|


