|
»Click here to display Table of Contents«
|

Result Tab |

|

|

|

|
|
Result Tab |
|
|

|

|
|
»Click here to display Table of Contents«
|
Result Tab |
|
|
|
|
|
Result Tab |
|
|
|
|
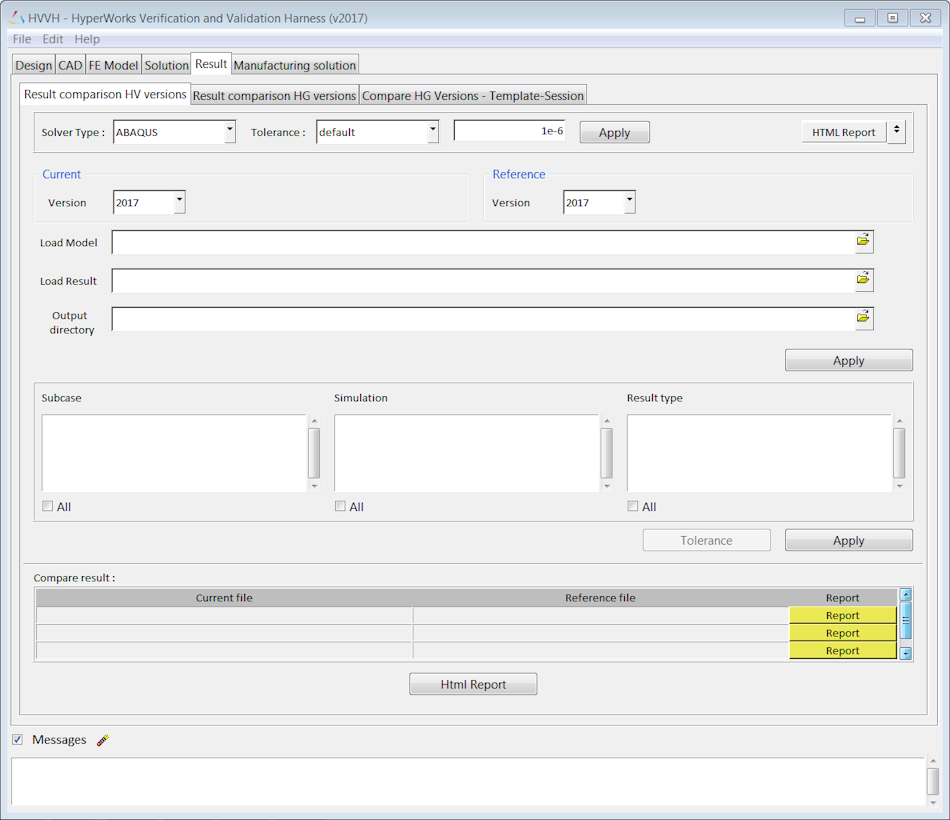
The Result comparison HV versions tab ensures that HyperView does not deprecate any result information after post-processing.
Different levels of verification and validation include:
|
|||||||||||||||||||||||||||
Solver |
From the Solver drop-down menu, select a solver whose results are to be compared. Options include:
|
||||||||||||||||||||||||||
Tolerance |
The value used to set the tolerance for the difference in values between the reference and current version result files during comparison. From the Tolerance drop-down menu, select default, scalar, tensor, or vector. Default - 1e-6 for all three (Scalar, Tensor, and Vector, if not individually chosen). Scalar – Enter values if different for the scalar result type. Vector – Enter values if different for vector result type. Tensor – Enter values if different for tensor result type. User defined tolerance – Set the individual tolerance value for all data types. |
||||||||||||||||||||||||||
Apply |
Click Apply to set new values (enter the values in the text box). |
||||||||||||||||||||||||||
PPT ReportHTML Report |
PPT Report - Select this option to have your results displayed in a PowerPoint report. HTML Report - Select this option to have your results displayed in HTML. Use one of these options to generate a PowerPoint or HTML report of the result value comparison. For Pass - This returns a detailed report containing one slide per data type across load cases. For Fail - In case of a failure, one slide per load case for each datatype is published so that it is easy to identify the load case that contains a difference in values. |
||||||||||||||||||||||||||
Current and Reference |
The Current and Reference sections contain the following option: Version - Select the HyperView version from the drop-down menu. |
||||||||||||||||||||||||||
Load Model |
Select the HyperView model file. |
||||||||||||||||||||||||||
Load Result |
Select the HyperView results file. |
||||||||||||||||||||||||||
Output directory |
Click the file open icon, |
||||||||||||||||||||||||||
Apply |
Click Apply to apply store your results information. |
||||||||||||||||||||||||||
SubcaseSimulationResult Type |
Select any combination of Subcase, Simulation, and Result type from the populated areas. Click All to select all items listed. |
||||||||||||||||||||||||||
Apply |
Click Apply to generate data to compare the results with combinations of all of the above: subcase, simulation and datatype. |
||||||||||||||||||||||||||
Compare result |
The Compare result section displays the current file and the corresponding Reference file. Click Report to display the diff report detailing the differences between the files. |
||||||||||||||||||||||||||
Messages |
Click Messages to view any error messages. |
||||||||||||||||||||||||||
Html Report |
Generates an HTML report of your session information for any number of files run through the process. |
||||||||||||||||||||||||||
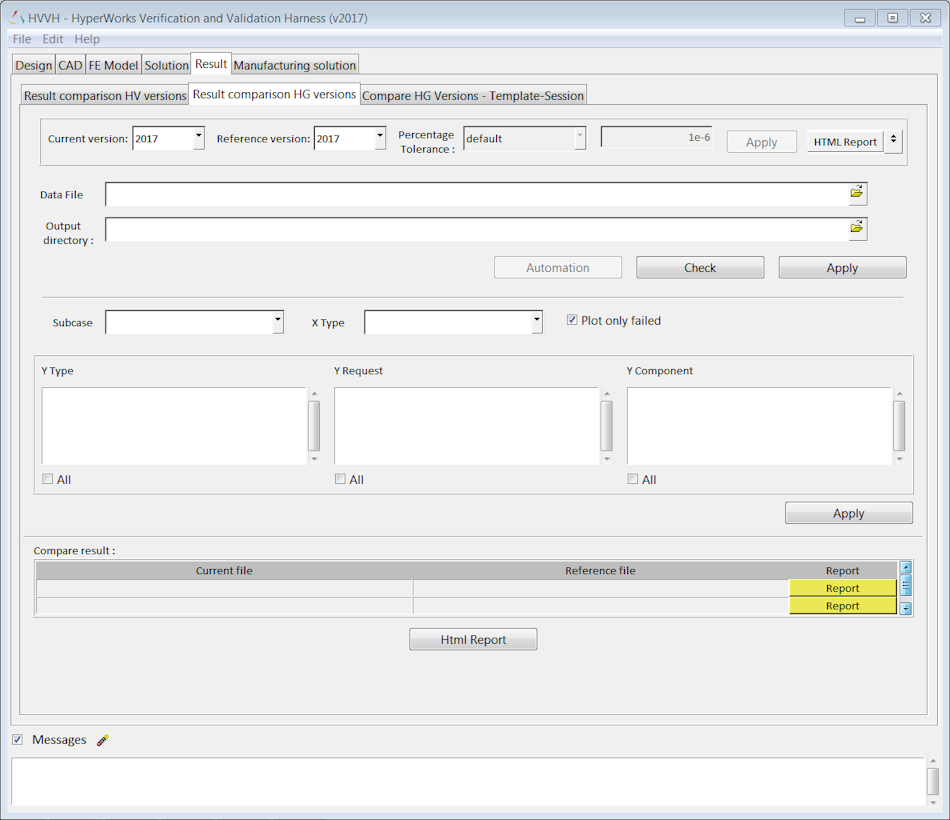
The Result comparison HG versions tab performs time history comparison. From this tab, you can perform the curve's super positioning of the current and reference version result files and plot the differences in curves.
|
|
Current Version |
Select the current HyperWorks version number from the drop-down menu. |
Reference Version |
Select the HyperWorks version number of your reference file from the drop-down menu. |
PPT ReportHTML Report |
PPT Report - Select this option to have your results displayed in a PowerPoint report. HTML Report - Select this option to have your results displayed in HTML. Use one of these options to generate a PowerPoint or HTML report of the result value comparison. |
Data File |
Click the file open icon, |
Output directory |
Click |
Check |
Extract and compare TRCs in the Current and Reference versions. |
Apply |
Click Apply to extract information from the data file. |
Subcase |
Select a subcase from the drop-down menu. |
X Type |
Select an X type from the drop-down menu. |
Plot only failed |
Activate the Plot only failed check-box to only plot failed graphs. |
Y TypeY RequestY Component |
Select any combination of Y Type, Y Request, and Y Component from the populated areas. |
Apply |
Click Apply to generate TH plots with the selected Y Type, Y Request, and Y Component. |
Compare result |
The Compare result section displays the current file and the corresponding Reference file. Click Report to display the diff report detailing the differences between files. |
Messages |
Click Messages to view any error messages. |
Html Report |
Generates an HTML report of your session information for any number of files run through the process. |
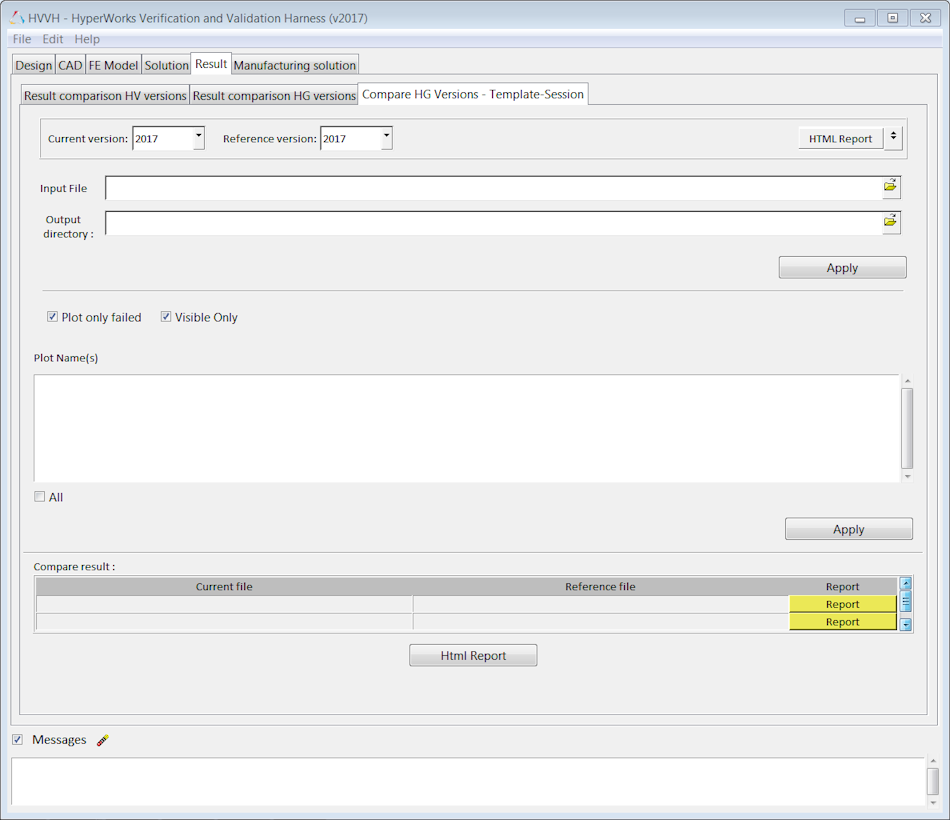
The Compare HG Versions - Template-Session tab performs time history comparison. From this tab, you can perform the curve super positioning of the current and reference version result files and plot the difference in curves. |
|
|
|
Current Version |
Select the current HyperWorks version number from the drop-down menu. |
Reference Version |
Select the HyperWorks version number of your reference file from the drop-down menu. |
PPT ReportHTML Report |
PPT Report - Select this option to have your results displayed in a PowerPoint report. HTML Report - Select this option to have your results displayed in HTML. Use one of these options to generate a PowerPoint or HTML report of the result value comparison. |
Input File |
Click the file open icon, |
Output directory |
Click |
Apply |
Click Apply to extract information from the data file. |
Plot only failed |
Click on Plot only failed check-box to plot only failed graphs. |
Visible Only |
Click on Visible Only check-box to plot only visible graphs. |
Plot Name(s) |
Extract plot names from Session or Template file and display in list box. |
Apply |
Click Apply to generate TH plots with the selected Y Type, Y Request and Y Component. |
Compare result |
The Compare result section displays the current file and the corresponding Reference file. Click Report to display the diff report detailing the differences between files. |
Messages |
Click Messages to view any error messages. |
Html Report |
Generates an HTML report of your session information for any number of files run through the process. |