From the Measures panel, you can create a vector across any portion of a static or movie image and display the value of the vector in pixels. After you create a vector, the values for the vector's initial and final positions, the vector length, and the Delta X and Delta Y values are displayed on the panel and in the graphics area.
The Measures panel support units, which allows you to specify a Master Unit Measure, which is a conversion factor used for scaling. This unit definition is saved in the session file, and can be used later in the Marker Tracing panel. You can also define additional static and dynamic measures, specify if the master unit measure should be used in marker tracing, and customize the measure display options.
After creating a measure, you can use it to create a curve in a preview plot, a new plot, or an existing plot.
To access the Measure panel, click on the Measure button  on the Annotations toolbar, or select Measure from the Annotations menu.

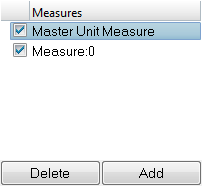
Measures panel
Measure are displayed in the Measures list and can be added and deleted using the Add and Delete buttons.

Measures list
|
The first item in the list is the static Master Unit Measure. The Master Unit Measure has the following properties:
| • | It is off (unchecked) and empty by default. If you want to use a master unit measure, you must select it from the list, define the endpoints, and activate it by clicking the check box. |
| • | It cannot be renamed or deleted. |
| • | When Master Unit Measure is selected, Static Measure is automatically selected and the combo box is disabled. |
| Note | While there can be multiple measures in a single session, there can only be one Master Unit Measure. |
| The checkbox associated with the Master Unit Measure applies only to its display state. If a master unit measure has been defined, and is then unchecked in the list, the measure itself and its unit definition still exist, but the measure is not displayed in the graphics area. |
|
The following measure types are supported:
Static measures are measures with endpoints defined anywhere in the frame, and the measure is linked to the specific time step/frame of creation. The master unit measure is always defined as a static measure.
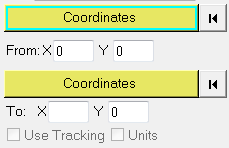
The following fields are displayed for Master Unit and Static measures:
Option
|
Description
|
Coordinate Collectors
|
There are two coordinate collectors for each endpoint. Only one is active at any given time, with the first one active by default. The second collectors becomes active after you select the first set of coordinates.

|
From/To
|
You can edit the X and Y coordinate values in the From and To fields.
|
Pixel value field
|
The disabled pixel field displays the length of the measure, in pixels. The editable field allows you to specify the distance equal to that length. Choose a unit type from the drop-down menu and enter a value in the edit field.

|
Use Tracking
|
Use Tracking is disabled by default if a tracking system has not been defined in the Marker Tracking panel and if disabled if the Master Unit Measure is not selected. This is a global setting that applies to all measures. Checking this box causes measures to be reported with respect to the tracking system defined on the marker tracking system panel (see Marker Tracking System panel).
|
Units
|
The Units option is disabled by default if a Master Unit Measure has not been defined. Once it is defined, this option is automatically enabled and checked. This specifies that the defined units and pixel conversion factor defined by the master unit measure should be used when showing the magnitude, Delta X, and Delta Y values, and when plotting any curves created from the measures. This is a global setting that applies to all measures.
|
Dynamic measures refer to existing markers as their endpoints. Dynamic measures are only visible as long as both of the referenced markers used as endpoints are visible in the frame. If either marker goes out of the frame or is not visible for any reason, the measure becomes invalid for that time step and is longer visible. If the tracing data for the marker has not yet been calculated, a dynamic measure using that marker will not be visible.
When you add a dynamic measure, two marker collectors for each endpoint are displayed. Only one is active at any given time, with the first one active by default. The second collector becomes active after you select the first marker.
The marker names for each endpoint are displayed beneath each marker collector. These fields are not editable.
|
When you click Add, a measure with the default name Measure N (Measure 1, 2, and so on) is added to the end of the list. After you add the measure to the list, you define it in the graphics area.
The first point that you click on the image in the graphics area is automatically set as the start point for the measure. A line is displayed and updated dynamically when you move the mouse. The next point that you click on the image is set as the end point for the measure. When you select the endpoint, the line between the two points remains in the graphics area, and the measure information is displayed. When you add a measure, any markers defined in the video will be pre-highlighted when the mouse passes over them. This allows you to clearly select a marker, if the measure is to be dynamic.
Select a measure from the list and click Delete to remove it from the list.
In addition, you can access the following context menu options by right-clicking anywhere within the Measures list:

Option
|
Description
|
Delete
|
Deletes the selected measure(s) from the list.
Note This is disabled for the master unit measure.
|
Rename
|
Displays the Rename dialog, which allows you to rename the selected measure.
Note This is disabled for the master unit measure.
|
Show
|
Displays the selected measure(s) in the graphics area and activates the corresponding check box(s).
|
Hide
|
Hides the selected measure(s) in the graphics area and deactivates the corresponding check box(s).
|
Double-clicking on a measure in the list box jumps to the time step/frame of the measure’s creation and shows the measure.
|
The options under Displayed Values allow you to choose the information for the select measure that is displayed in the graphics area.
Option
|
Description
|
Magnitude
|
Displays the length of the measure in the graphics area. If a Master Unit Measure has been defined and Units is selected, the length is displayed in defined units; otherwise it is displayed in pixels.
|
X
|
Displays the Delta X value for the measure.
|
Y
|
Displays the Delta Y value for the measure.
|
Endpoint Coordinates
|
Displays the X and Y coordinates at the endpoints of the measure.
|
Name
|
Displays the name of the measure.
|
At time of creation
|
Displays the measure only at the time step at which it was created. This options is disabled if the selected measure is dynamic. If this option is off, the measure is visible at all times.
|
|
Option
|
Description
|
Format
|
Displays the selected measure’s values in fixed or scientific format.
|
Precision
|
Specify the displayed precision of the selected measure’s value.
|
Font Button
|
Click the font button,  , to display the Font Selector dialog. This dialog allows you to select the font type, font style, and font size. , to display the Font Selector dialog. This dialog allows you to select the font type, font style, and font size.
|
Color Box
|
Click the color box to select a measure color from the pop-up dialog. By default, the Master Unit Measure color is cyan, static measures (other than the master unit measure) are red, and dynamic measures are green.
|
|
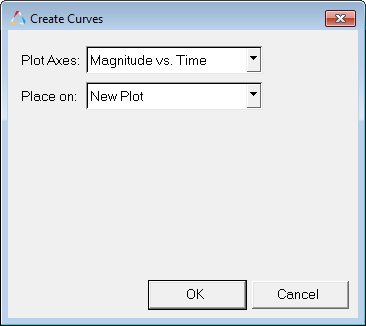
Click to display the Create Curves dialog. This dialog allows you to create curves from selected measures and place them on a plot.

Create Curves Options
|
Plot Axes
Choose the plot axes type from the following options:
|
Select one of the following options from the Place on menu:
Preview plot - Allows you to review curves in a preview window.
New plot - The curve is created in the next available empty window. If no such window exists, then the page layout is changed to the layout with an empty window. If no empty window is found, then a new page is added.
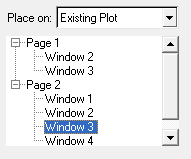
Existing plot - The curve is created in an existing plot window that was selected from the page and window tree.

|
OK
|
Click OK to create a curve with the specified placement and plot axes in a HyperGraph window, using the selected units (if specified).
|
Cancel
|
Click Cancel to disregard the settings and exit the dialog.
|
|
The Display Control icon is located on the vertical toolbar on the left-hand side of the graphics area. Clicking this icon with the left mouse button displays a context menu with the following options:
| • | Measures - Toggles the visibility setting of all measures in the active window. A check to the left of the menu item indicates the state of this display option. |
| • | Markers - Toggles the visibility setting of all markers in the active window. A check to the left of the menu item indicates the state of this display option. |
|
How do I...
| 1. | From the Measure panel, click Add. |
A measure with a default name is added to the list.
| 2. | Select Static from the drop-down menu above the Coordinate collector. |
| 3. | Click on a point on the image in the graphics area. This point is set as the start point for the measure. |
A line is displayed and updated dynamically when you move the mouse.
| 4. | Drag the pointer to another point on the image and click the left mouse button. |
The line between the two points remains in the graphics area.
Values for the measures start and end positions, the measure length, and the Delta X and Delta Y values are displayed on the panel.
| 5. | Verify that the measure is still selected in the Measures list. |
| 6. | Select options under Displayed Values and Display options to change the measure information that is displayed in the graphics area. |
| 7. | To delete the measure, click Delete. |
The measure is removed from the list.
|
| 1. | From the Measure panel, select a measure from the Measures list. |
| 2. | Click the Create Curves button. |
The Create Curves dialog is displayed.
| 3. | From the Plot Axes menu, choose the plot axes type from the following options: |
| 4. | From the Place on drop-down menu, select a destination for the curve. |
| 5. | If you selected Existing plot, select a plot from the session tree and click OK. |
The curve is added to the existing plot in HyperGraph.
| 6. | If you selected Preview plot: |
The curve is displayed in the Plot preview dialog.
| • | Click the X in the upper right corner to close the dialog. |
| 7. | If you selected New plot, click OK. |
A plot is created in a HyperGraph window. The position of the plot in the window is based on the next available page layout.
|


![]() on the Annotations toolbar, or select Measure from the Annotations menu.
on the Annotations toolbar, or select Measure from the Annotations menu.