Use the Edit Curves panel to create new curves or edit existing ones. Each vector can be defined using either a data file or a math expression. For example, the data source for the x vector could be a file, and the data source for the y vector could be a math expression. The data sources for the x and y vectors are displayed in the x = and y = fields.
Subpanels and Inputs
The Edit Curves panel contains the following subpanels:
Panel Inputs
Input
|
Action
|
plot
|
Select the plot on which to create the curve. An untitled plot is created if no plot currently exists.
|
x / y
|
Displays the data sources for the x and y vectors once they are selected.
|
file
|
Use this radio button if you want have a file that contains your curve data.
|
type
|
Data type.
Appears when file is selected. Click the button to view a list of the available data types, or click the + or - at the end of the field to scroll through the list forward or backward one type at a time.
|
req
|
Data request set.
Appears when file is selected. Click the button to view a list of the available requests, or click the + or - at the end of the field to scroll through the list forward or backward one type at a time.
|
comp
|
Component
Appears when file is selected. Click the button to view a list of the available components, or click the + or - at the end of the field to scroll through the list forward or backward one type at a time.
|
math
|
Use this radio button if you want to use a math expression for your curve data.
Math functions are listed in the Math Reference section of the online help.
The math expression must evaluate to an array.
|
|
Use the Modify subpanel to edit an existing curve by changing the data source for the x or y vector or by applying a mathematical expression.
To access the x and y vectors of a curve, you must indicate the curve number and the x or y vector, in the format, c#.vector: For example:
c1.x To reference the x vector of curve 1.
c1.y To reference the y vector of curve 1.
If you try to reference a curve that has not been created with this panel, a pop-up window appears with the message, "This curve has no defined source. Convert to math curve?" Respond by clicking Yes or No. If the selected curve has too many points, it cannot be converted.
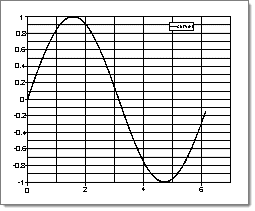
Example:
x = 0:6.14:.01
y = sin (x)
|

|
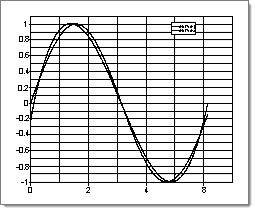
Example 2:
x = c1.x
y = polyfit(c1.x, c1.y, 3)
|

|
Panel Inputs
Input
|
Action
|
curve
|
Select the curve to modify.
|
x / y
|
Displays the data sources for the x and y vectors once they are selected.
|
file
|
Use this radio button if you want have a file that contains your curve data.
|
type
|
Data type.
Appears when file is selected. Click the button to view a list of the available data types, or click the + or - at the end of the field to scroll through the list forward or backward one type at a time.
|
req
|
Data request set.
Appears when file is selected. Click the button to view a list of the available requests, or click the + or - at the end of the field to scroll through the list forward or backward one type at a time.
|
comp
|
Component
Appears when file is selected. Click the button to view a list of the available components, or click the + or - at the end of the field to scroll through the list forward or backward one type at a time.
|
math
|
Use this radio button if you want to use a math expression for your curve data.
Math functions are listed in the Math Reference section of the online help.
The math expression must evaluate to an array.
|
|
See Also:
Alphabetical List of Panels


