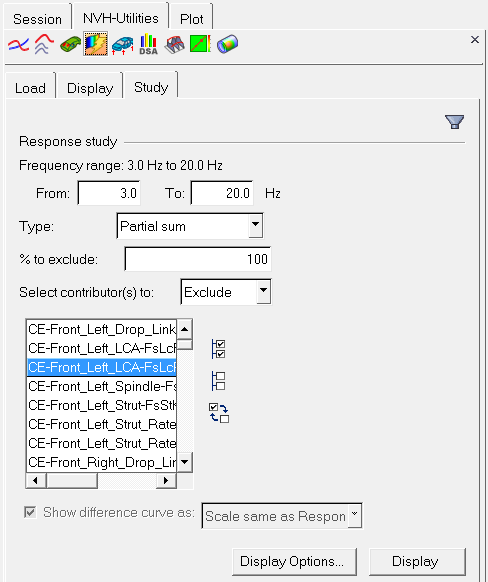
From the Study sub-tab, you can perform a Partial sum, Modify energy, or Energy overlay response study. To enable this option, you must first plot the energy contribution curves.
NVH-Utilities Browser - Study tab (Energy Distribution Analysis)
Option
|
Description
|
Frequency range
|
Indicates the available range, based on the frequencies that your energy distribution analysis has performed.
Using the From and To fields, you can customize your own frequency range.
|
Type
|
The type of response study.
Partial sum - Select energy distribution to exclude from the total system energy, with an optional percentage to exclude.
|
% to Exclude
|
Optional field that allows you to exclude a percentage of the energy distribution from the total system energy.
You can also filter energy contributors to a smaller set by clicking the Filter Contributors dialog icon,  . .
|
Select contributors(s) to
|
Select the energy distribution that you want to exclude or include in the response study.
| • | Click  to select the entire list of energy contributions. to select the entire list of energy contributions. |
| • | Click  to deselect your current selections. to deselect your current selections. |
| • | Click  exchange the currently selected energy distribution for the unselected energy distribution in the list. exchange the currently selected energy distribution for the unselected energy distribution in the list. |
|
Show difference curve as
|
Shows a difference curve between the original energy distribution analysis response and the Partial sum or the Modified energy energy distribution analysis response curves.
% of response - The difference curve shows the difference as a percentage of the original energy distribution analysis response.
Scale same as response - The difference curve shows the difference using the same scale as used in the response plot.
|
Display Options
|
Launches the Display Options dialog, which allows you to further customize the plot.
|
Display
|
Displays the response study plot once your selections are complete.
|
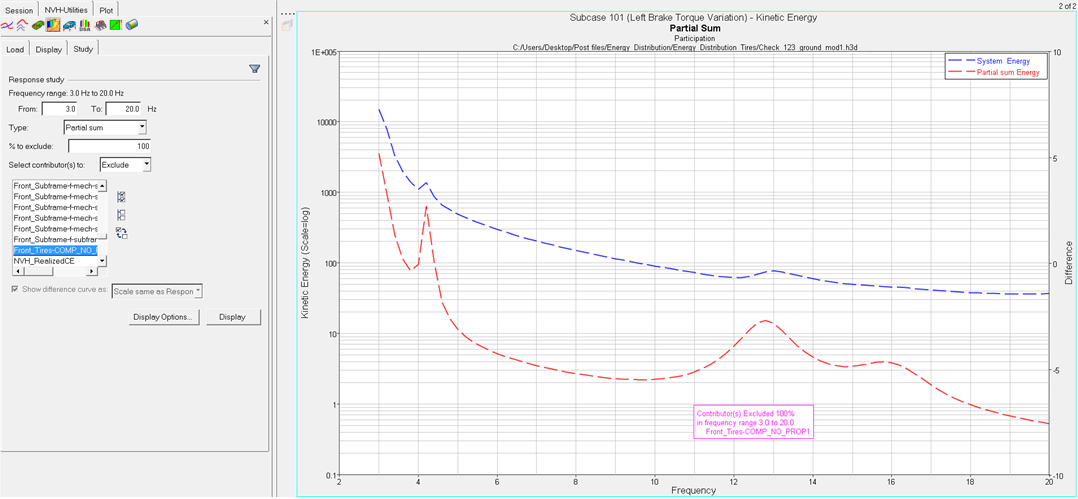
NVH-Utilities Browser - Study tab > Partial sum plot (Energy Distribution Analysis)
See Also:
Energy Distribution Analysis - Load Tab
Energy Distribution Analysis - Display Tab
Display Options Dialog
Filter Contributors Dialog


