Integrated Diagnostics |

|

|

|

|
|
Integrated Diagnostics |

|

|

|

|
Note: The Integrated Diagnostics utility is part of the Packaged Solution Offerings (PSO), and will require a PSO license feature to activate.
In HyperGraph 2D, the Integrated Diagnostics utility allows you to plot and overlay response curves from an OptiStruct or Nastran punch file and perform diagnostic studies using the diagnostic result display capabilities.
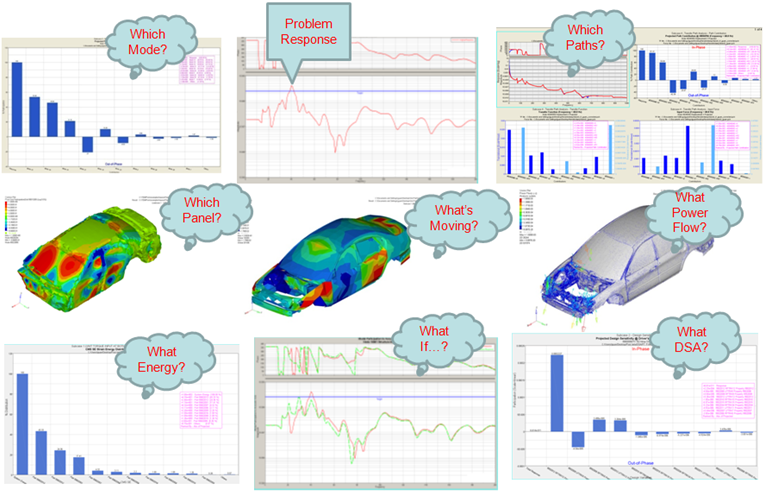
Problem resolution in NVH is primarily about understanding the physical behavior of system dynamics. This is true with CAE as well as testing. A typical NVH diagnostic process flow and commonly used diagnostic results are shown here:

Typical NVH diagnostic process flow and results
The advantage in diagnosing an NVH problem using CAE is that a large amount of systems behavior data can be easily generated, which in many cases is difficult or impossible to obtain from hardware testing. In addition, CAE diagnostic results often represent mathematically derived cause and effect relationships to the related NVH responses, and therefore are more specific and effective in helping you identify solutions to your NVH problems.
Managing the large amount of CAE-generated diagnostic data can be complex and time consuming. The Integrated Diagnostics utility is designed to manage the various NVH diagnostic results and serve them based on user demands. This is accomplished by building connections between responses and their related diagnostic results, thereby automating NVH diagnostics. This allows you to focus on understanding the system dynamics and eliminate the data management burden.
The fundamental focus of this utility is the concept of events. In the NVH field, events are typically related to standard tests that isolate NVH phenomenon to those caused by specific external inputs. Examples of NVH events include engine idle, engine wide open throttle (WOT), rough road at 30 MPH, or brake roughness. In CAE simulation, each event is typically associated with one or more analysis subcase(s) in which system responses are calculated. In NVH, responses are typically driver or passenger touch or experience points, such as steering wheel vertical response, inboard seat track bolt response, or left ear sound pressure level, for example. In the Integrated Diagnostics utility, you are expected to associate response subcases to a particular event. Each response subcase can include multiple responses and directions. Each response direction can then be associated with a number of diagnostic results. |
Diagnostic results can be classified into the following categories:
|
NVH problems are typically characterized by frequencies where a response is over the targeted value. As a result, you are often more interested in understanding the system behavior at these frequencies of interest, referred to as concern frequencies. To reduce the volume of diagnostic data, a common practice is to request a diagnostic request for diagnostic result output only at the concern frequencies of the respective response. The Diagnostic Results dialog of the Integrated Diagnostics utility captures the concern frequencies in a separate column:
NVH-Utilities - Diagnostic Results dialog (Integrated Diagnostics) |
To access the Integrated Diagnostics utility, you must register the NVH preferences file and load the NVH Utilities. See NVH Menu for more information.
NVH menu An NVH-Utilities tab is added to the browser. This browser tab contains the Load tab. It also contains icons for other utilities, such as modal participation,
NVH-Utilities Browser - Load tab (Integrated Diagnostics)
|
See Also: