Integrated Diagnostics - Load Tab |

|

|

|

|
|
Integrated Diagnostics - Load Tab |

|

|

|

|
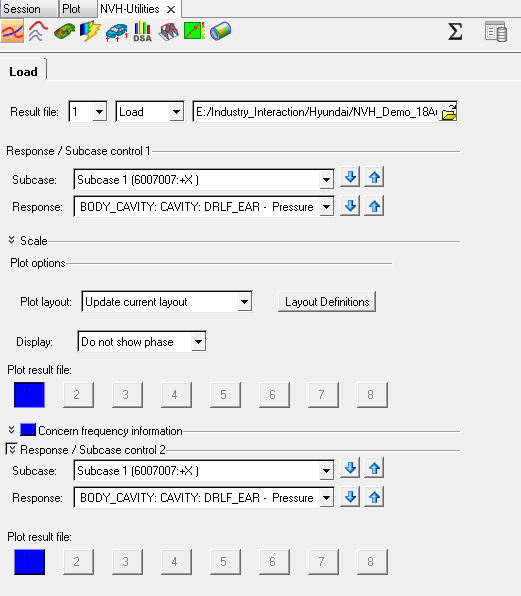
From the NVH-Utilities tab > Integrated Diagnostics > Load tab, load an OptiStruct or Nastran PCH file that contains one or more response subcase(s) data.

NVH Utilities Browser- Load tab (Integrated Diagnostics)
Option |
Description |
||||||
|---|---|---|---|---|---|---|---|
Result file |
In the Result file section, select a .pch file and click Load. Upon reading the file, other fields on the Load tab are populated. |
||||||
File ID |
Select a file ID from 1 through 8. A total of eight files can be overlayed at each time. |
||||||
File action |
Select an action from the drop-down menu to apply to the file ID:
|
||||||
File path |
Select an OptiStruct or Nastran .pch file that contains one or more response subcase data. |
||||||
Respone/Subcase Control 1 and Control 2 |
The following fields are available under Response/Subcase. Once the result selection options are complete, click Load Response to further investigate the participations. |
||||||
Subcase |
Select an analysis subcase from the drop-down menu. Use the up and down arrow buttons to go to the next item in the list. |
||||||
Response |
Select the grid ID and component of the response from the drop-down menu. Use the up and down arrow buttons to go to the next item in the list. |
||||||
Scale |
The following options are available under Scale: |
||||||
Linear |
Plots the linear values. |
||||||
Logarithmic |
Plots the values in logarithmic scale. With this scale, data points are spread out more, which makes it easier to view. |
||||||
dB10 |
10 logarithmic of the participation value over the reference value. |
||||||
dB20 |
20 logarithmic of the participation value over the reference value. For acoustic responses, the reference pressure is 20E-12 MPa. |
||||||
Weighting |
A – A-weighting is used to define equal loudness sound pressure levels. B – B-weighting is used to define equal loudness sound pressure levels. C – C-weighting is used to define equal loudness sound pressure levels. U – U-weighting is used to define equal loudness sound pressure levels. |
||||||
Unit |
The Unit option allows you to display unit information in the axes labels. Place a check mark in the Unit box to enable this feature; remove it to disable this feature. The entity units are derived from unit sets for Time, Length and Force. For example, the acceleration is m/s2 if Time is set to seconds (s), Length is set to meters (m), and Force is set to Newtons (N). |
||||||
Plot layout |
Allows you to select how the plots are displayed in the window. |
||||||
Update current layout |
Current plot/layout is updated in the active window. |
||||||
Plot response in a new page |
The response is plotted into a new window on a new page. |
||||||
Copy current layout in new page |
Current plot/layout is copied and placed into a new window on a new page. |
||||||
Layout Definitions |
Saves the diagnostic layout for responses. Import/export the layout definitions in the template files. |
||||||
Display |
Do not show phase - Hides the phase values on the plot. Show phase - Displays the phase values on the plot. |
||||||
Plot Result File |
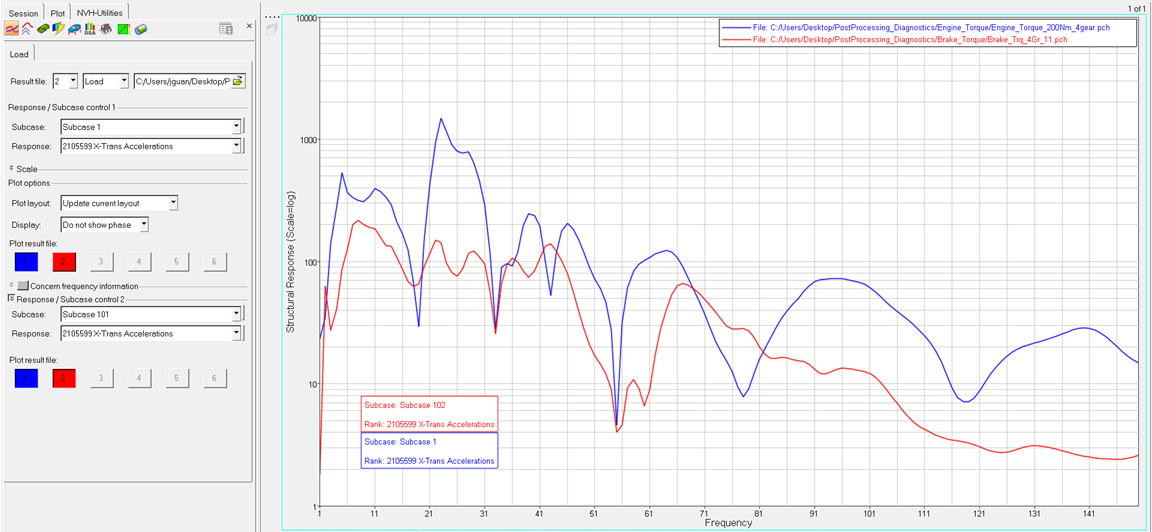
Click on a numbered button to toggle the response display from the file. The plot line color matches the numbered button color. |
||||||
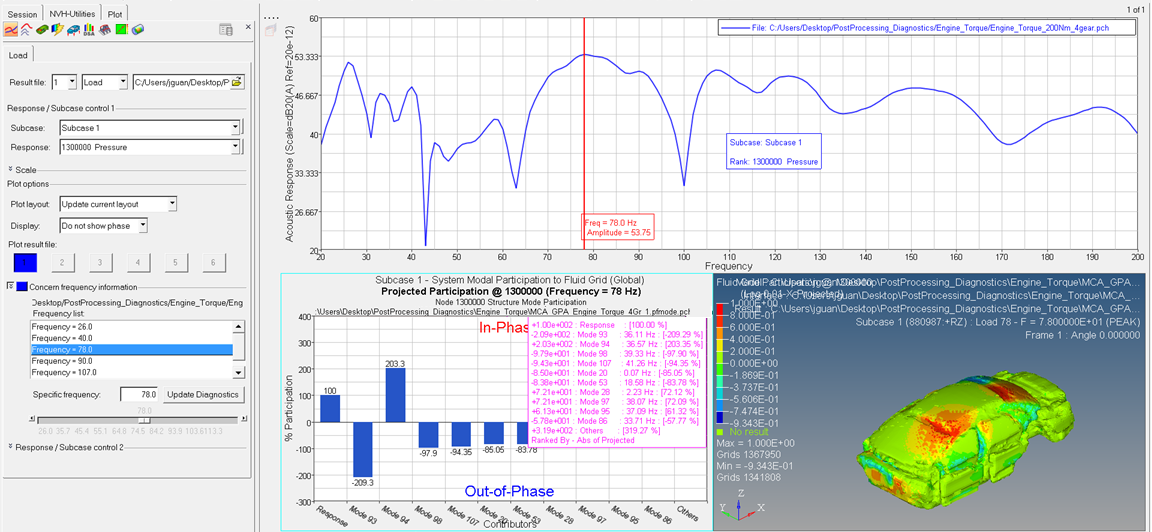
Concern frequency Information |
The concern frequencies are populated once diagnostic results are loaded. |
||||||

NVH Utilities Browser - Response diagnostics by integrated use of NVH utilities (Integrated Diagnostics)

NVH Utilities Browser- Overlay of results from different iterations/files (Integrated Diagnostics)