Modal/Panel Participation - Load Tab |

|

|

|

|
|
Modal/Panel Participation - Load Tab |

|

|

|

|
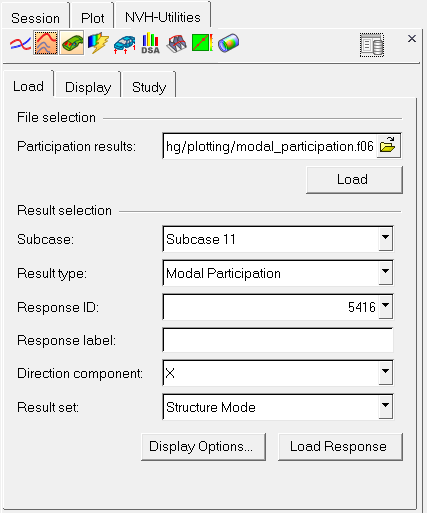
From the NVH-Utilities tab > Modal/Panel Participation > Load sub-tab, select an OptiStruct .h3d or MSC Nastran .f06/.pch file that you want to plot modal/panel participation data for.

NVH-Utilities Browser - Load tab (Modal/Panel Participation)
Option |
Description |
|||||||||||||||||
|---|---|---|---|---|---|---|---|---|---|---|---|---|---|---|---|---|---|---|
File selection |
From the Load tab, under File selection/Participation results, select an OptiStruct .h3d file or an MSC Nastran .f06/.pch file and click Load. Upon reading the file, the Result selection fields are populated. |
|||||||||||||||||
Result selection |
The following fields are available under Result selection. Once the result selection options are complete, select Load Response to further investigate the participations. |
|||||||||||||||||
Subcase |
Select an analysis subcase. |
|||||||||||||||||
Result type |
Select a participation result type. Options include:
|
|||||||||||||||||
Response ID |
Grid ID of the response for which Modal/Panel participation results are available. Select one from the list. |
|||||||||||||||||
Response label (optional) |
Enter a label that describes the response, for example "Driver’s Ear". |
|||||||||||||||||
Direction component |
X, Y, or Z. |
|||||||||||||||||
Result set (optional) |
Options include:
|
|||||||||||||||||
Display Options |
The Display Options dialog allows you to customize the response plot, including scale, weighting, and the plot layout. |
|||||||||||||||||
Load Response |
Once the result selection options are complete, select Load Response to display the file data. |
|||||||||||||||||
Modal/Panel Participation - Display Tab