Modal/Panel Participation |

|

|

|

|
|
Modal/Panel Participation |

|

|

|

|
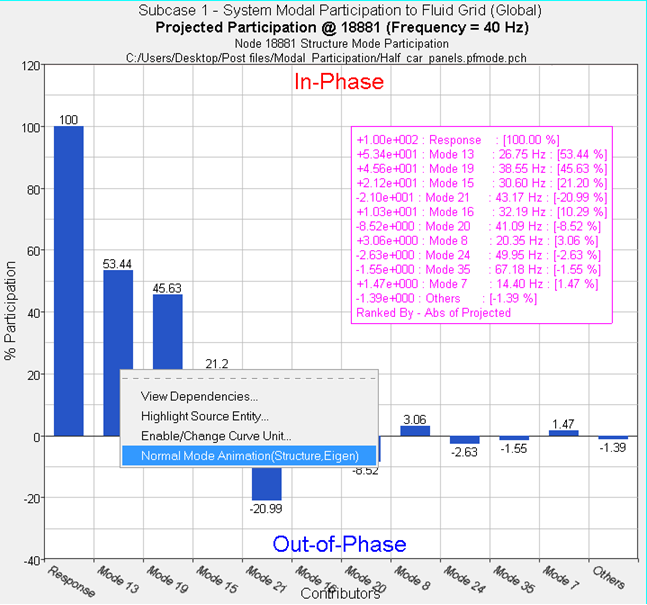
Modal participation represents the complex contribution of a structure or fluid mode to a response. These modes can be systems modes in a modal frequency response analysis, or component modes from CMS superelement subsystems. Modal participation can be output from a modal frequency response analysis using the PFMODE output request card.
Panel contribution represents the complex contribution of all grids on a structural panel to a response. It can be output from a modal frequency response analysis using the PFPANEL output request card.
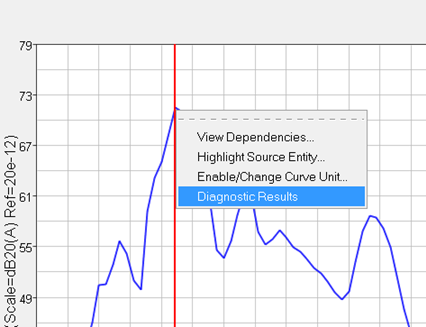
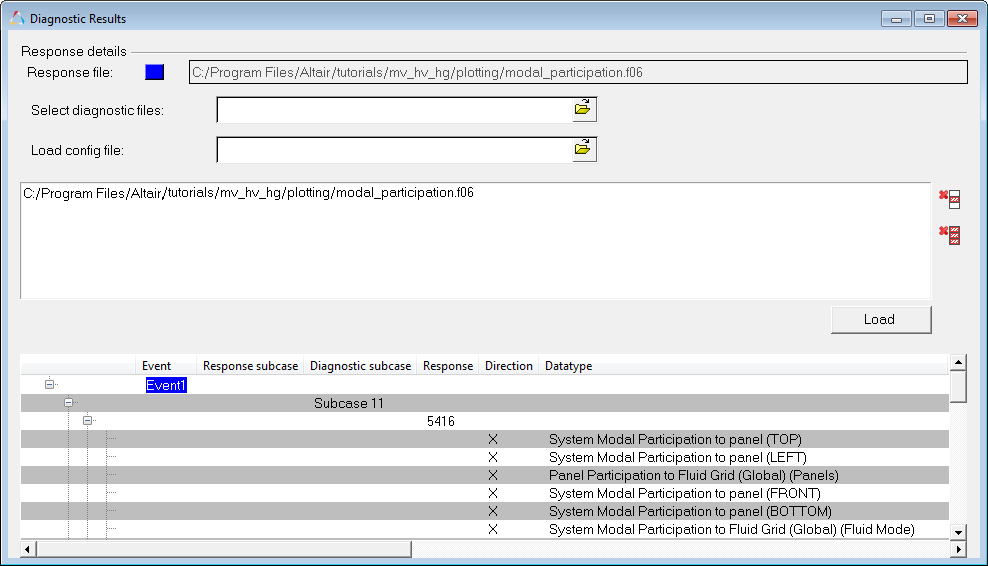
Normal modes data can be associated to modal participation results using the Diagnostic Results option on the right-click context sensitive menu of the response plot. Select and load a normal modes data file from the Diagnostic Results dialog and click OK once the data in the file is loaded. A dynamic context sensitive menu item Normal Mode Animation is available from the modal participation bar plot, which when selected, generates a normal modes animation plot.

Response plot - context sensitive menu

Diagnostic Results dialog

Normal Mode Animation context sensitive menu item accessed from the modal participation bar plot
In HyperGraph 2D, the NVH Modal/Panel Participation utility allows you to plot modal/panel participation curves from an OptiStruct .h3d file
Preferences dialog The NVH menu is added to the toolbar.
NVH menu An NVH-Utilities tab is added to the browser. This browser tab contains the following sub-tabs: Load, Display and Study. It also contains icons for modal participation,
NVH-Utilities Browser - Load tab
|
Modal/Panel Participation - Load Tab
Modal/Panel Participation - Display Tab