Multiple Sample Analysis - Loads MSA - Load Tab |

|

|

|

|
|
Multiple Sample Analysis - Loads MSA - Load Tab |

|

|

|

|
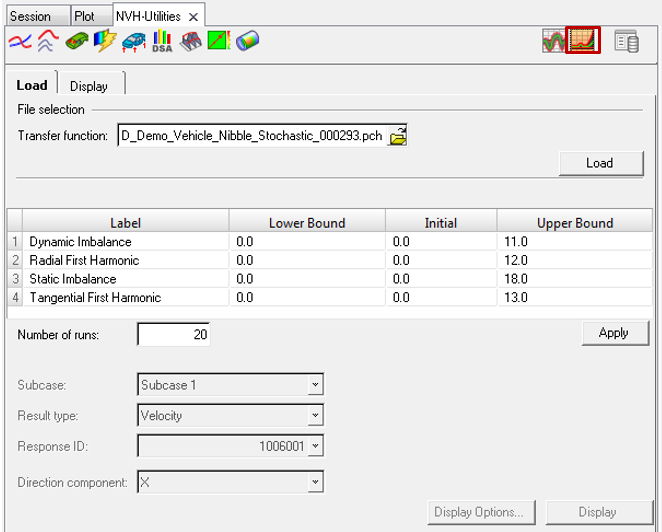
From the Multiple Sample Analysis > Loads MSA > Load sub-tab, select an OptiStruct/Nastran .pch file that contains transfer function results for wheel sensitivity.

NVH-Utilities Browser - Load tab (Loads MSA)
Option |
Description |
|||||||||
|---|---|---|---|---|---|---|---|---|---|---|
File Selection |
Select a transfer function .pch file |
|||||||||
|
Label |
Subcase labels from the transfer function result file. |
||||||||
|
Lower Bound |
Lower bound value for the imbalance mass. |
||||||||
|
Initial |
Nominal value for the imbalance mass. |
||||||||
|
Upper Bound |
Upper bound value for the imbalance mass. |
||||||||
Number of runs |
The number of HyperStudy runs to be formulated and executed. |
|||||||||
Subcase |
Select an analysis subcase. |
|||||||||
Result type |
Select a response result type. Options include:
|
|||||||||
Response ID |
Grid ID of the response for which response results are available. Select one from the list. |
|||||||||
Direction component |
X, Y, or Z. |
|||||||||
Display Options |
Launches the Display Options dialog, which allows you to customize the response study plot, including scale, weighting, and the plot layout. |
|||||||||
Display |
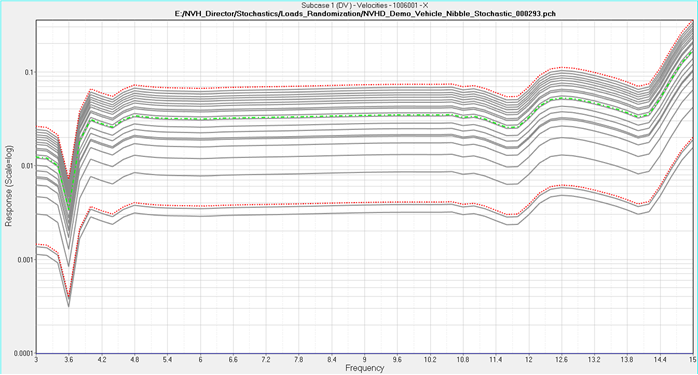
Once the result selection options are complete, select Load Response to display the scatter of the NVH response. |
|||||||||

NVH -Utilities Browser – NVH Response Scatter plot (Loads MSA)