Order Analysis - Study Tab |

|

|

|

|
|
Order Analysis - Study Tab |

|

|

|

|
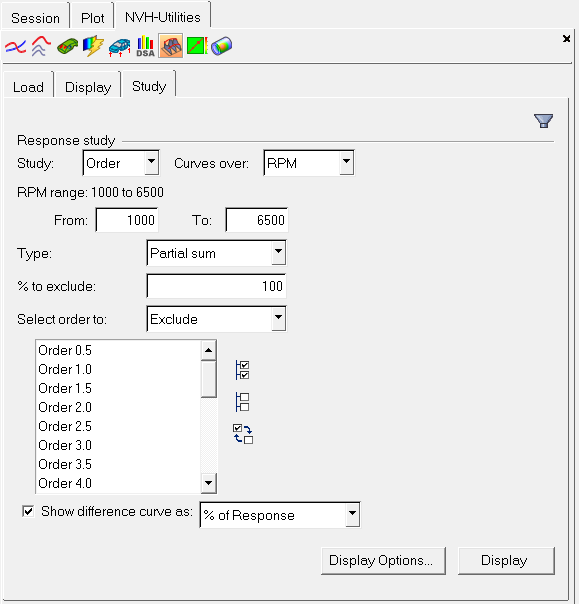
From the Study sub-tab, you can perform a Partial sum or Order overlay response study. To enable this option, you must first plot the order analysis curves.

NVH-Utilities Browser - Study tab (Order Analysis)
Option |
Description |
||||||
Study Curves over |
Select the type of study to display. Choose between RPM or Frequency. |
||||||
RPM range |
Indicates the available range, based on your results file. Using the From and To fields, you can customize your own RPM range. |
||||||
Type |
The type of response study. Partial sum study - Select a number of orders to exclude from the order sum response, with an optional percentage to exclude. Order overlay - Select specific order curves to overlay with the order sum response. |
||||||
% to Exclude |
Optional field that allows you to exclude a percentage of the orders from the order sum response. |
||||||
Select order to: |
Select the orders that you want to exclude or include in the response study.
|
||||||
Show difference curve as |
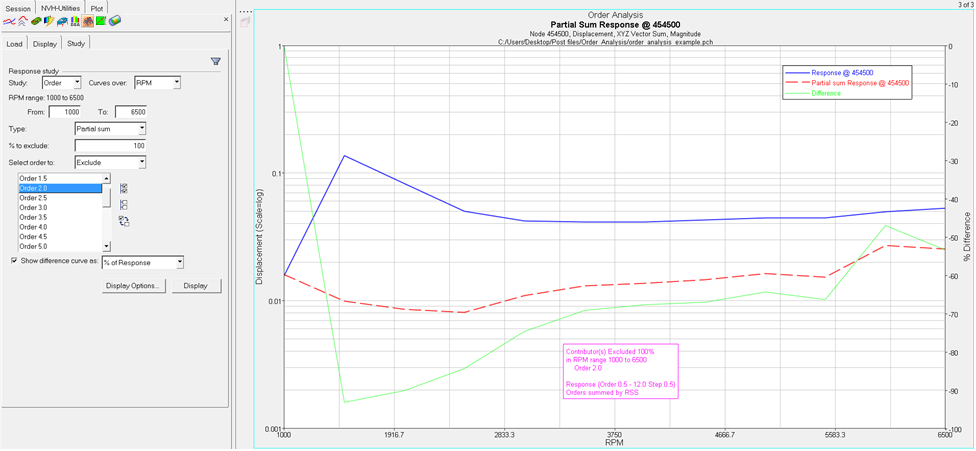
Shows the difference between the original curve and the partial sum curves. To determine how the difference curve is displayed, select one of the following options from the drop-down menu: % of Response Select same as Response |
||||||
Display Options |
Launches the Display Options dialog, which allows you to further customize the plot. |
||||||
Display |
Click Display to display the response study plot once your selections are complete. |

NVH-Utilities Browser – Response study plot (Order Analysis)