HG-1030: Referencing and Filtering Curves |

|

|

|

|
|
HG-1030: Referencing and Filtering Curves |

|

|

|

|
In this tutorial you will learn how to reference and filter curves.
The Define Curves panel can be accessed in one of the following ways:
| • | Click on the Define Curves icon |
Or
| • | From the menu bar select Curves > Define Curves. |
This panel allows you to edit existing curves and create new ones. The Define Curves panel also provides access to the program's curve calculator.

X and y vector expressions can reference any curve vector in the session. A curve vector reference defines the x or y vector (values) by page, window, and curve number. An example of a curve vector reference is p2w3c4.x, where:
p2 |
is page 2 |
w3 |
is window 3 |
c4 |
is curve 4 |
x |
is the vector |
There are two common methods to specify curve vector references:
Pick a curve in a plot window |
For the x = input field. |
SHIFT and pick the curve to get the curve x vector reference |
|
|
SHIFT + CTRL and pick the curve to get the curve y vector reference |
|
for y = input field. |
SHIFT and pick the curve to get the curve y vector reference |
|
|
SHIFT + CTRL and pick the curve to get the curve x vector reference |
Select a curve vector reference from the Curves… dialog, which is accessed from the Define Curves panel. |
||
Exercise: Filtering a curve from the Define Curves panel
Step 1: Open Session File saefilter.mvw
| 1. | From the File menu, click Open > Session. |
| 2. | From the plotting folder, select the saefilter.mvw file and click Open. |
Step 2: Filter a curve using the SAE J211/1 filter.
| 1. | Click on the Define Curves panel button |
| 2. | Click Add and add a new curve. |
| 3. | Change the name of the new curve from Curve 1 to SAE J211/1 FILTER in the text box over the curve list. |
| 4. | Check the radio button for Math under Source:. |
| 5. | Verify that the x vector is active. |
| 6. | Hold the SHIFT key and click on the curve in the plot window. |
The x = curve reference is p1w1c1.x.
| 7. | Click the y = field, and click Filter… from the panel menu to display the Filter dialog. |
| 8. | Select the filter class SAE J211/1 from the Filter Class drop-down menu. |
| 9. | Select Filter Class: 60, Padding: Mirror padding, and Direction: Fwd-Back. |
| 10. | Click OK to complete the selection and close the Filter dialog. |
| 11. | Hold down the SHIFT + CTRL keys, then select the existing curve. |
| 12. | The x vector curve reference is entered in the saefilt95 function. |
| 13. | Hold down the SHIFT key and select the curve again. |
Note: the curve's y vector is referenced in the saefilt95 function. The y = field should read: saefilt95(p1w1c1.x,p1w1c1.y,60,1,3).
| 14. | Click Apply to create the filtered curve. |
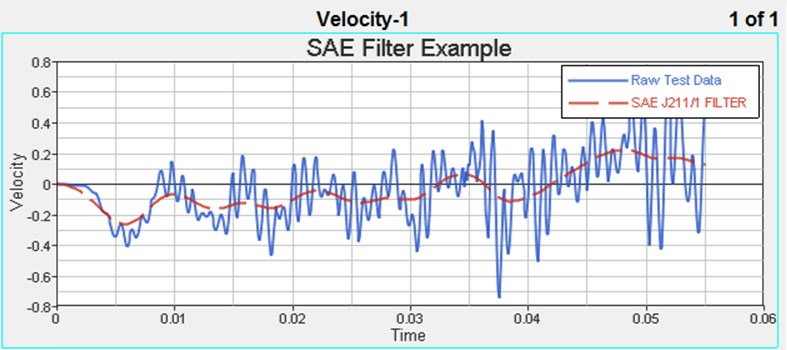
Exercise: Filtering a curve using the Vehicle Safety Tools and Plot Macros panel
Step 1: Load the ANGACC file.
| 1. | From the Options panel, verify that Enable Unit Scaling is selected. |
| 2. | From the toolbar, click Add Page, |
| 3. | From the Built Plots panel, load the ANGACC file, located in the ..\plotting\madymo folder. |
| 4. | Click the expand button, |
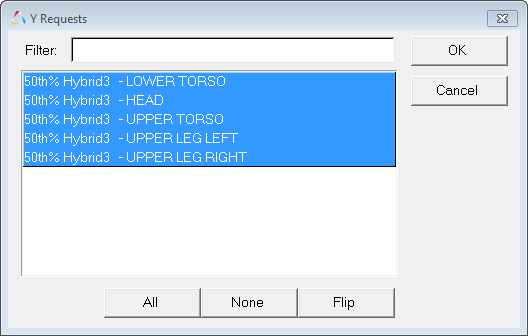
| 5. | Click All to select all the requests listed. Click OK to close the dialog. |
| 6. | Under Y Component, click All to select all components in the list. |
| 7. | From the Layout drop-down menu, select One Plot Per Request. |
| 8. | Click the window layout icon and choose the two-window layout. |
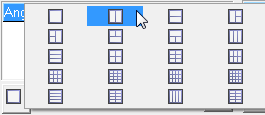
| 9. | Click Apply. |
The following plots are displayed:
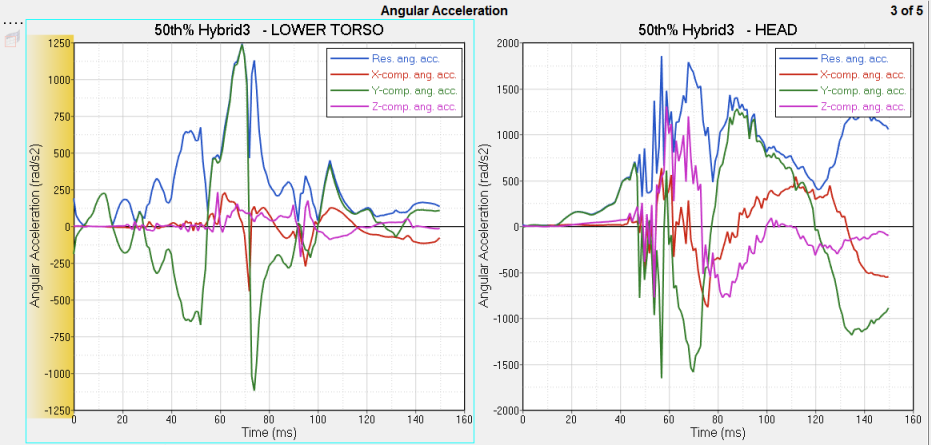
| 10. | Click the Next Page icon, |
Step 2: Filter a curve using the SAE J211/1 filter through the Vehicle Safety Tools menu.
| 1. | Select File > Load > Preference File. |
| 2. | From the Preferences dialog, select Vehicle Safety Tools and click Load. |
The Vehicle Safety Tools menus are displayed in the menu bar.
| 3. | From the Filter menu, select SAE General > SAE (J211, Mar 1995) > Mirror Padding > Fwd-Back. |
The Plot Macros panel is displayed.

| 4. | For Filter class, change the value to 180. |
Note: Time scaling is done automatically since Enable Units is activated from the Options panel.
| 5. | To select all the curves at once, double-click Curve to display the Select Curves dialog. |
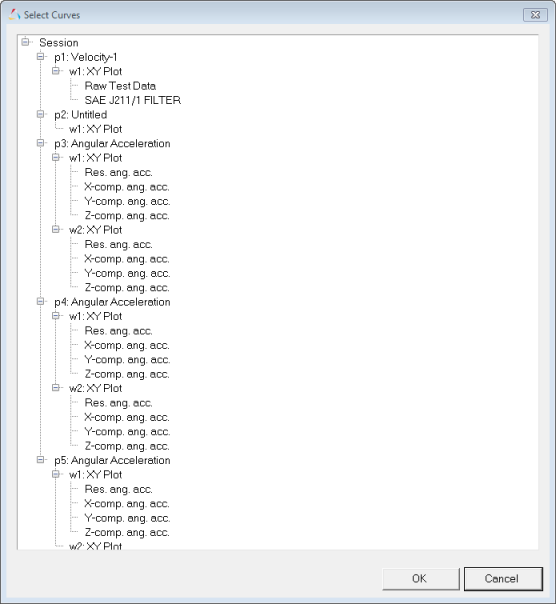
| 6. | To select the curves on pages 3-5, select p3: Angular Accelearation, hold down the SHIFT key, and select Z-comp ang. acc. under p5: Angular Acceleration. |
All of the master references are inserted into the Curve field.

| 7. | Under Layout, select Hide Input Curves. |
| 8. | Click Apply. |
All curves are filtered.
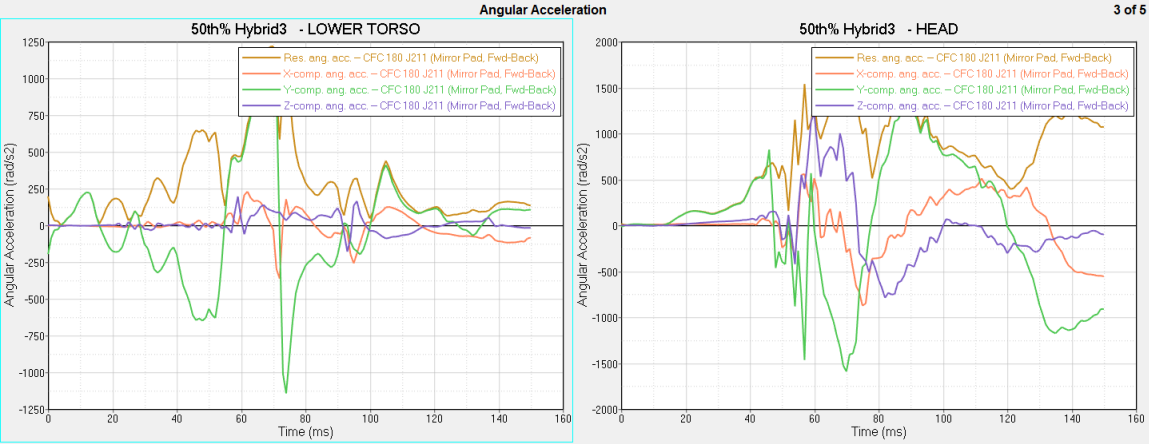
| 9. | Click |
| 10. | The automatic unit scaling allows you to change the time from milliseconds to seconds, for example, without changing the curves. |
| 11. | Right-click from the X axis and from the Convert Units menu, select s. The curves remain the same as when Time was set to milliseconds. |