Plot Titles Panel |

|

|

|

|
|
Plot Titles Panel |

|

|

|

|
Location: Post page – xy plots panel
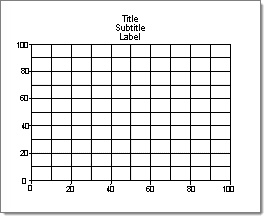
Use the Plot Titles panel to edit the title information contained in a plot. Use this function to edit the titles, subtitles and labels that appear at the top of the plot. You may also change the color and the size of the font used in the plot titles. The update function allows you to change the title attributes of several plots at once.

There are no subpanels on the Plot Titles panel. All inputs and command buttons are located on the main panel.
Input |
Action |
plot = |
Click plot =, then select the plot to which you want to add or change the plot titles. |
plots |
Use this selector to pick multiple plots. |
title = |
The title of the selected plot displays here, and can be edited. |
subtitle = |
The subtitle of the selected plot displays here, and can be edited. |
label = |
The label of the selected plot displays here, and can be edited. |
colors: title / subtitle / label |
Each color button can be clicked, and a color chosen from the standard palette, to assign a color to the corresponding text. |
fonts: title / subtitle / label |
Each font switch can be used to assign a font for the corresponding text. |
The following action buttons appear:
Button |
Action |
update |
When you select one or more plots and click this button, the plot attributes that can be updated populate the input fields. You can then make changes and click update again to apply them. |
return |
Exit the panel. |
See Also: