In this tutorial, you will learn how to:
Understand applications for and be able to extract resultant forces and moments from HyperMesh free body diagram (FBD) capabilities, including defining cross-sections for which resultant forces and moments are calculated
Perform free body diagrams within HyperMesh to understand load paths and export free body loads to detailed models of interest as boundary conditions (BCs) within a submodeling scheme. This process is graphically shown for reference, following.
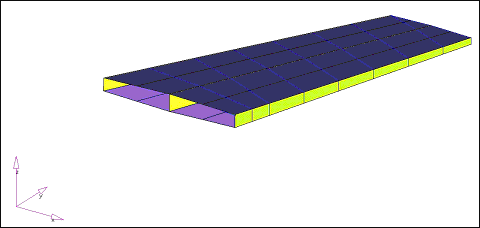
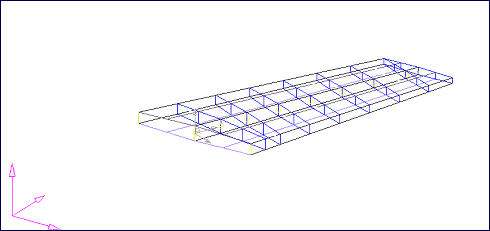
Global loads model of a generic wing.
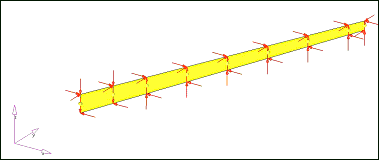
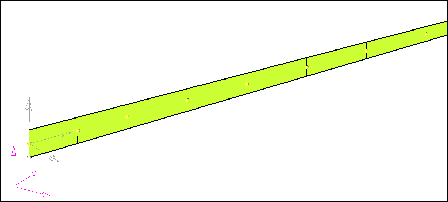
Spar2 element set from the global loads model (middle Spar) with free body loads extracted.
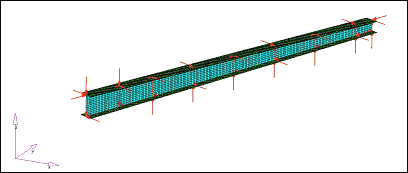
Detailed model of Spar2 with free body loads applied as BCs from global loads model.
Model Files
This tutorial uses the icw_ex1.hm and icw_ex2.hm files, which can be found in the hm.zip file. Copy the file(s) from this directory to your working directory.
Exercise 1: Creating of Shear Moment Diagrams and Potato Plots from Global Loads Model using Resultant Force and Moment Functionality
This exercise uses the model file, icw_ex2.hm.

Step 1: Create a coordinate system for spar2.
| 1. | Open HyperMesh Desktop. |
| 2. | In the User Profiles dialog, set the user profile to OptiStruct. |
| 3. | Open model file, icw_ex1.hm. |
| 4. | Open the Sets browser by clicking Tools > Set Browser from the menu bar. |
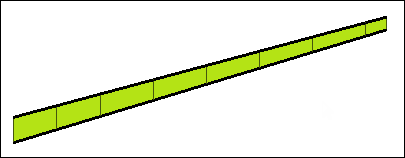
Since you will be working with Spar2, you will need to display the elements which represent Spar2 in the graphics area. Element sets, in addition to components and assemblies, can be used as a model grouping and visualization tool. Elements sets can be created, deleted, made visible, and hidden using the Set browser.
| 5. | In the Sets browser, Elements folder, right-click on Spar2 and select Isolate from the context menu. The elements representing Spar2 display in the graphics area. |
| 6. | Turn on element shading by clicking  (Shaded Elements and Mesh Lines) on the Visualization toolbar. (Shaded Elements and Mesh Lines) on the Visualization toolbar. |
| 7. | Open the Nodes panel by clicking Geometry > Create > Nodes > Interpolate Nodes from the menu bar. |
| 8. | Using the node list selector, select the nodes on the top and bottom of the left side. |
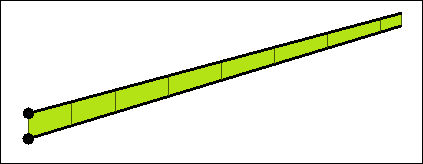
| 9. | Click create. HyperMesh creates a node on the left end of Spar2. |
| 10. | Repeat step 1.8 and 1.9 to create a node on the right side of Spar2. |
| 11. | Click return to exit the Nodes panel. |
| 12. | From the menu bar, click Geometry > Create > Systems > Axis Direction. |
| 13. | Go to the create by axis direction subpanel to create a system with origin at the left end and x-axis along the length of the spar. |
| 14. | Using the origin selector, select the left-middle node. |
| 15. | Using the x-axis selector, select the right-middle node for x-axis node. |
| 16. | Using the xy plane selector, select the left-top node for the xy-plane node. |
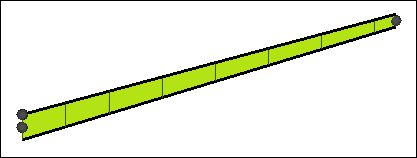
| 17. | Toggle to rectangular. |
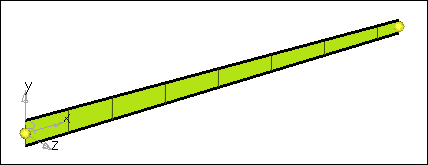
| 19. | Click return to exit the Systems panel. |
Step 2: Create cross-section definitions for Spar2.
| 1. | Open the FBD Cross-Section Manager tab by clicking Post > Free Body > Cross-Section from the menu bar. |
Cross-section definitions are determined by the following criteria:
| • | An element set that contains the nodes that define the cross-section and determines which "side" the resultant force and moment vectors are to be calculated. Only elements connected to the nodes that define the cross-section, on one side or the other, need to be included in the element set. However, additional elements can be included for visualization purposes with no effect on the calculations. |
| • | A node set that defines the cross-section geometry. |
| • | A summation node that can be any node in the model or that can be automatically set to the calculated centroid of the defined cross-section. Centroidal calculations are performed using nodal coordinates that make up the cross-section only, hence element thicknesses associated with the elements attached to the section are not considered. As such, there could be slight differences in the calculated centroid and the "true" centroid of the section if thicknesses vary throughout the section or the section is overly idealized. |
| • | (Optional) A result system that defines the coordinate system for which the resultant force and moment vectors are transformed into and output for the selected cross-section(s). |
| 2. | In the FDB Cross-section Manager tab, click the arrow next to Advanced options to display the Auto create cross-section form. |
Use this form to create cross-sections along the length of Spar2.
Resultant force and moment extractions will be performed on these cross-sections to obtain the necessary data to generate shear moment diagrams and potato plots. There are two options to define cross-sections: a manual method and an advanced method. The advanced method automates the creation of "continuous" cross-sections. The advanced method will be used in this tutorial. See the online help for details about the manual method.
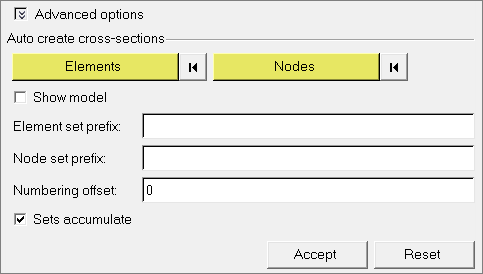
| 4. | In the panel area, click elems > by sets. |
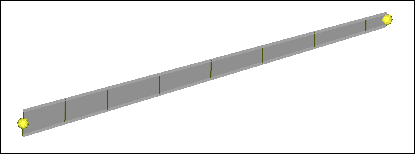
| 8. | In the FBD Cross-section Manager tab, click Nodes twice. |
| 9. | Select the left-top and left-bottom nodes which define the first cross-section for Spar2. |
| 11. | In the Element set prefix field, enter Spar2_E. |
| 12. | In the Node set prefix, enter Spar2_N. |
Since the cross-section manager utility creates the necessary element and node sets, you must define a prefix string for both element and node sets. This string will be appended by an incremental number to give each created set a unique name. Optional input includes numbering offset which defines an initial number for which the appended set numbers will begin.
| 13. | Verify that the Sets accumulate checkbox is selected. |
A spreadsheet populates with the definitions of the cross-sections generated by the Auto create cross-sections utility.
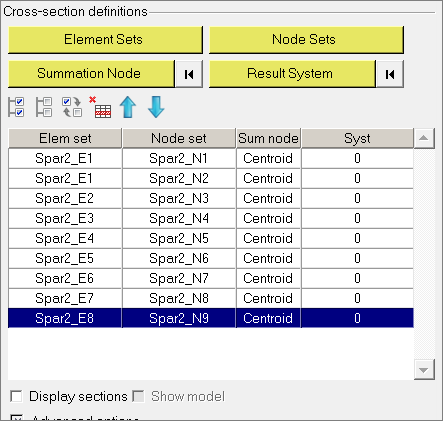
| 15. | Select the Display sections checkbox, and then select any section in the spreadsheet to review the selected cross-section. |
The graphics area will be updated with the element set, node set, sum node, and result system that define the selected cross-section. Optionally, if you select the Show model checkbox, the entire model will be visible in the graphics area with the selected cross-section highlighted in red and the remainder of the model transparent.
| 16. | Select the first cross-section in the spreadsheet (Spar2_E1; Spar2_N1), hold SHIFT, and select the last cross-section (Spar2_E8; Spar2_N9) to select the cross-sections for updating their result system. |
| 17. | Update any single or multiple cross-sections by selecting the cross-sections from the spreadsheet using CTRL/SHIFT and then selecting Summation Node or Result System to update these definitions for all selected cross-sections. |
| 18. | Click Result System twice. |
| 19. | Select the system located at the left-middle end of Spar2 (system 102 created in Step 1). |
Note: You may have to display the Longeron2 system collector from the Model browser (Model tab) to display system 102.
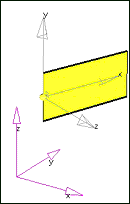
All cross-sections update to result system 102. Note that system 102 has the x-axis along the length of the spar, y-axis located at the neutral axis of the beam in the plane of the web, and z-axis perpendicular to the web of the beam. Also note that the sum node is set to the default centroid, which automatically calculates the centroid of each cross-section and at which the resulting resultant force and moment calculations will be performed. The result system is the system for which all resultant force and moment result vectors will be transformed into and output.
| 21. | Close the FBD Cross-Section Manager utility. |
Step 3: Extract resultant force and moment data for all cross-sections of Spar2 for all load cases.
| 1. | Open the Resultant Force and Moment tab by clicking Post > Free Body > Resultant Force and Moment from the menu bar. |
| 2. | In the .op2/xdb field, open the icw.op2. The selected .op2 file loads into the HyperMesh database for use with all FBD utilities until another .op2 file is selected. It also populates the Subcases list box with all subcases in the selected .op2 file that contain Grid Point Force (GPFORCE) data. See the FBD documentation in the HyperMesh User's Guide for more details. |
| 3. | From the Loadsteps list, select all of the loadsteps using the filter buttons on the top of the list box or with CTRL/SHIFT. |
| 4. | From the Cross-sections list, select all of the Spar2 cross-sections previously defined using the filter buttons on the top of the list box or with CTRL/SHIFT. |
| 5. | Review the following table for a description of the Output options for the resultant force and moment utility. |
Function
|
Description
|
Coordinate System
|
Defines the coordinate system used for output of node locations (x,y,z) only. The coordinate system does not affect the transformation of the resultant force and moment vector results, which is defined by the result system on each cross-section definition.
|
Zero tolerance
|
Defines any number less than this number is set to zero for numerical issues.
|
Create load collectors
|
Creates load collectors containing the results of the resultant force and moment calculations so that the results can be visualized in the graphics area as force and moment vectors.
|
Show summary table
|
Brings up a window with formatted results similar to the .csv (comma separated) file. Use this output for quick checks of the data without having to open an alternative spreadsheet or text editor program.
|
Create .csv file
|
Creates a .csv file with the results of the resultant force and moment calculations, which can be opened directly within standard spreadsheet applications.
|
Create .fbd file
|
Creates an .fbd file with the results of the resultant force and moment calculations, which can be directly read into HyperGraph to create shear moment diagrams and potato plots.
|
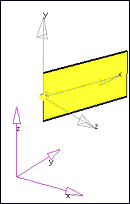
| 6. | Click Coordinate system twice. |
| 7. | Select coordinate system 102 which is located at left-middle end of Spar2. |
Note: You may have to display the Longeron2 system collector from the Model browser to display system 102.
| 9. | In the Zero tolerance field, enter 0.01. |
| 10. | Select the Create load collectors checkbox and optionally select a default color for the created load collectors. |
| 11. | Select the Show summary table checkbox. |
| 12. | Select the Create .csv file checkbox, and open an existing .csv file (append data) or enter a new file name; in this case, enter icw_res_force_moment.csv. |
| 13. | Select the Create .fbd file checkbox, and open an existing .fbd file (append data) or enter a new file name; in this case, enter icw_res_force_moment.fbd. |
By default, files are put into the HyperMesh start directory unless you specify another directory or enter a file name.
| 14. | Click Accept. Resultant force and moment calculations are executed on all of the selected cross-sections for all selected subcases. |
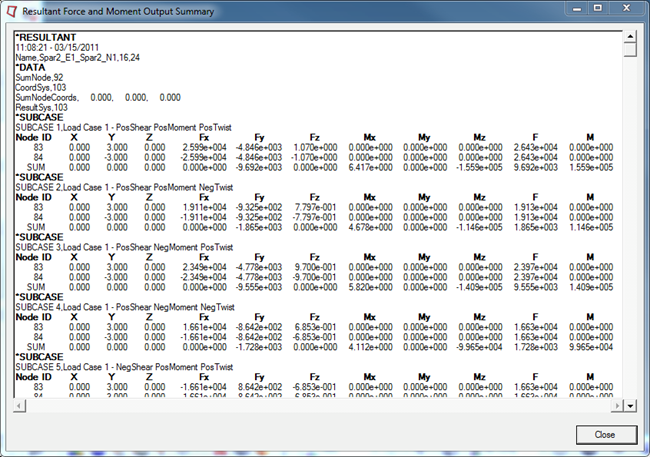
The Resultant Force and Moment Output Summary tab displays the resultant force and moment calculations (see the following image). For each cross-section, there is a separate data block grouped by loadstep. The data block contains cross-section nodal forces, moments, and the sum of those nodal forces and moments about the defined sum node, in this case the calculated centroid of the cross-section. Note that the sum of the moment components (Mx, My, Mz) for each node is not the direct sum, as the (rXF) terms for the force resultant vector about the sum node must also be added to each moment component appropriately. The sum of the forces components (Fx, Fy, Fz) for each node is, however, the simple sum.
| 15. | Optional. Open the .csv (comma separated) file directly with Microsoft Excel by using Windows Explorer and double-clicking the file, icw_res_force_moment.csv. |
This file contains the same results as the summary table in the previous image, but is available for import into standard spreadsheet or text editor programs.
| 16. | Optional. Open the .fbd file, icw_res_force_moment.fbd, in any standard text editor program. |
By default, files are put into the HyperMesh start directory unless you specify another directory or enter a file name.
This file contains the same results as the summary table in the previous image, but in a compact format for use with HyperGraph in generating shear moment diagrams and potato plots of resultant force and moment data for various cross-sections.
| 17. | Close the Resultant Force and Moment tab. |
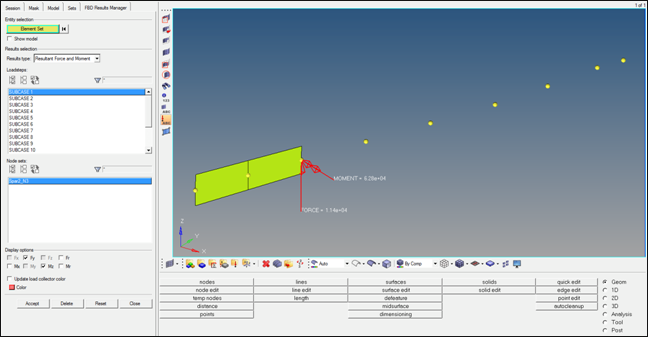
Vector review of the Resultant Force and Moment results in the graphics area is covered in the next step.
Step 4: Use FBD Results Manager to review resultant force and moment vectors in graphics area.
| 1. | From the menu bar, select Post > Free Body Results Manager to open the FBD Results Manager tab. |
| 2. | Click Element Set twice. |
| 3. | Click set, and select Spar2_E2. |
| 5. | In the FDB Results Manager window, activate the Show model check box to display the entire model with the selected element set highlighted in red and all other elements transparent. This feature will help you easily locate the element set within the model. |
| 6. | For Results type, select Resultant Force and Moment. |
This operation scans the database for available loadsteps with resultant force and moment results and populates the Loadsteps: list box.
| 7. | For Loadsteps, select SUBCASE1. |
This operation scans the database for available node sets with resultant force and moment results and populates the Node sets: list box.
| 8. | For Node sets, select Spar2_N3. |
This operation will scan the database for available force and moment vector results and will enable the check boxes for those force and moment vectors which are available.
| 9. | For Display options, select Fy (shear—the results coordinate system had y-axis in the plane of the web) and Mz (principal bending moment—the results coordinate system had z-axis perpendicular to the plane of the web). |
To determine the result coordinate system applied to a given cross-section of interest, use the FBD Cross-Section Manager to review the defined cross-section. This operation will show the element set, node set, results system, and sum node defined for the selected cross-section. Optionally, select other force components to review their magnitude and direction in the graphics area. Single or multiple force and moment vector results can be displayed in the graphics area to facilitate data mining and reporting.
| 10. | (Optional) Select Update load collector color and select color to change the color of the selected load vectors. |
The new color setting applies only to the load components selected and is saved in the database. Therefore, this option can be used to recolor any single or multiple load vectors for any FBD result.
| 11. | Click Accept to visualize the resultant force and moment vectors in the graphics area. |
| 12. | (Optional) Continue to review resultant force and moment vectors following Steps 4.2-4.14 for additional cross-sections. |
| 13. | Click Reset to clear the display and reset the form. |
| 14. | Click Close to exit FBD Results Manager. |
Step 5: Generate potato plots for Spar2 for selected cross-sections.
| 1. | Click the Add Page  to create a new page. to create a new page. |
| 2. | On the toolbar, use the pull-down menu to switch to the HyperGraph 2D client. |
| 3. | From the menu bar, select Tools > Free Body Diagrams > Potato Plot to open the Potato Plot dialog. |
| 4. | Click fbd file ( ) to load the file, icw_res_force_moment.fbd. ) to load the file, icw_res_force_moment.fbd. |
The available cross-sections and loadstpes within the .fbd file are loaded into the form.
| 5. | From the Sections list, select cross-section Spar2_E1_Spar2_N1 as the cross-section for which to generate potato plots. |
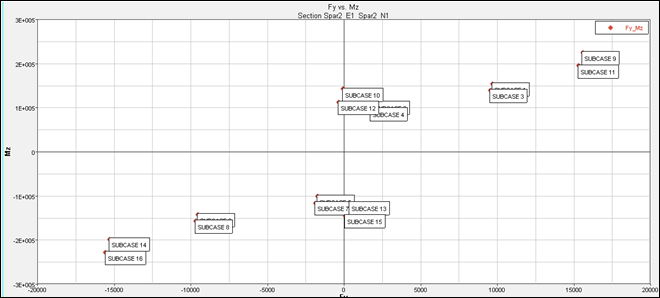
Potato plots generate a single plot for each selected cross-section which contains data points for all selected loadsteps Potato plots effectively "take a slice" through shear moment diagrams at a given cross-section for all selected loadsteps. Since Spar2_E1_Spar2_N1 is the wing root section for Spar2, it will be the largest loaded section and hence can be utilized to determine the critical loadsteps for Spar2. Potato plots can facilitate critical loadstep determination by identifying maximum and minimum loads on given cross-section. In this case, you are going to be interested in identifying maximum and minimum shear and moment forces, Fy and Mz respectively. There are other methods for determining critical loadsteps and standard practices and methods should be examined and utilized.
| 6. | From the Loadsteps list, select all loadsteps using filter buttons next to the list box or using CTRL/SHIFT. |
| 7. | On the Potato Plots tab, for X component select Fy (shear). |
| 8. | For Y Component, select Mz (principal bending moment). |
| Note: | You can add additional potato plots by selecting alternative X and Y components and clicking Add Plot. You can also delete defined plots by selecting the plots from the spreadsheet area and clicking Delete Plots. |
| 10. | (Optional) On the Plot Titles tab, enter a Title and Subtitle. |
| 11. | On the Plot Options tab, for Reverse sign select cross-section Spar2_E1_Spar2_N1 in the top drop-down list. |
| 12. | Select Reverse selected section in the bottom drop-down list. |
The explanation for the reverse cross-section options is discussed in Step 6.11.
| 13. | Activate the Label points: Loadstep check box. |
| 14. | Click Apply to generate the requested potato plots. |
Since one cross-section was selected, one plot will be generated (one for each cross-section). Potato plots are typically used to determine the loadsteps from which maximum/minimum behavior occurs. From the resulting potato plot of cross-section Spar2_E1_Spar2_N1 it can be determined that maximum/minimum loadsteps for shear and moment are SUBCASES 9, 11, 14, and 16. These critical loadsteps will be considered in future submodeling procedures as a subset of all the loadsteps used to design the spar. FBD forces will be extracted from these loadsteps in Exercise #2 and applied to a detailed model of Spar2 so that FBD analysis and design of the spar can be performed.
Step 6: Generate shear moment diagrams for Spar2 for selected subcases.
| 1. | Click the Add Page  to create a new page. to create a new page. |
| 2. | From the menu bar, select Tools > Free Body Diagrams > Shear Moment Plot to open the Shear Moment Plot panel. |
| 3. | Click fbd file ( ) to load the file, icw_res_force_moment.fbd. ) to load the file, icw_res_force_moment.fbd. |
The available cross-sections and loadsteps within the .fbd file are loaded into the form.
| 4. | From the Sections list, select all sections related to Spar2 (Spar2_E1_Spar_N1 through Spar2_E8_Spar2_N9) using filter buttons next to the list box or using CTRL/SHIFT. |
| 5. | From the Loadsteps list, select SUBCASE 9, SUBCASE 11, SUBCASE 14, and SUBCASE 16 the critical loadsteps determined in Step 6.5. |
| 6. | On the VMT Plots tab, for X component select X. The (X) X component is selected because the resultant force and moment extraction coordinate system was performed with coordinate system 102 which has the x-axis along the length of the Spar. |
Options for X component include X, Y, or Z coordinates as defined from the coordinate system selected to perform the resultant force and moment extraction (Step 3, part 6).
| 7. | On the VMT Plots tab, for Y component select Fy and Mz to plot the shear and principal bending moment for Spar2. |
To determine the result coordinate system applied to a given cross-section of interest, use FBD Cross-Section Manager to review the defined cross-section. This operation will show the element set, node set, results system, and sum node defined for the selected cross-section and can help in identifying which components of force or moment are required for the desired plot.
| 8. | (Optional) On the Plot Titles tab, type a Title and Subtitle. |
| 9. | On the Plot Options tab, for Reverse sign select cross-section Spar2_E1_Spar2_N1 in the top drop-down list. |
| 10. | Select Reverse selected section in the bottom drop-down list. |
The option allows for methods to reverse the sign of the results from any single or multiple cross-sections. The option is useful since, for this particular plot, all cross-sections were defined coming from the right. However the first section [Spar2_E1_Spar2_N1], since it has no elements to the left of this cross-section, can only be defined from the left. Cross-sections, defined by the nodes and elements within their respective sets, can be defined coming from the left or right depending on the elements chosen for any given nodal cross-section definition. Therefore any given cross-section can be defined from the left or from the right. The only difference in the results defined either way is that the results will be opposite in sign but equal in magnitude. Either way, for a shear moment diagram, it is important that all selected cross-sections be defined coming from the same direction so that the resulting plot is valid.
| 11. | Verify that the Envelop results check box is deactivated. |
If you only want the maximum/minimum selected Y components to be plotted from all selected loadsteps for each cross-section, activate the envelop check box. For this tutorial, do not activate this check box.
| 12. | For Layout, select the layout of plots desired. |
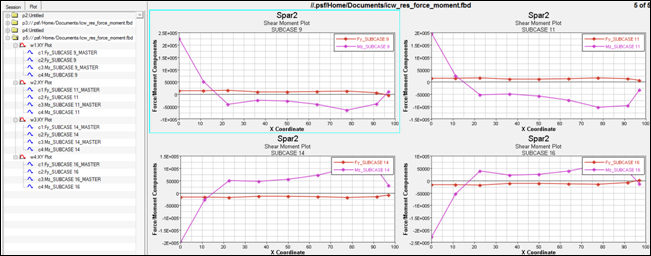
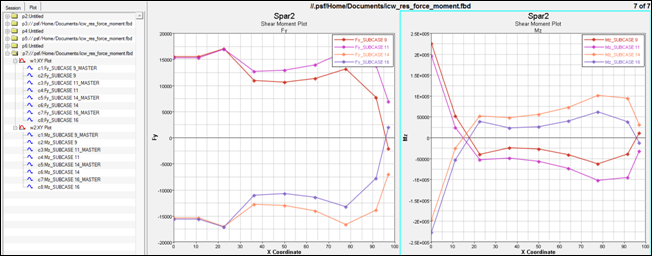
This option affects the number of resulting plots that will be generated. The options are: One plot per loadstep, One plot per Y Component, and One curve per plot. The total number of curves that are generated is always (Curves = number or loadsteps * number of Y components). In this example, since you selected four loadsteps and two Y components, there are a total of eight curves that will be extracted. The number of plots that these eight curves will be displayed on depends on the layout selection. With the option One Plot per loadstep, there are four plots since there are four loadsteps; each plot with both selected Y components, or in this case shear and moment on a single plot for each loadstep. The results of this layout option are shown in first picture, following. With the option, One Plot per Y component, there are two plots since there are two Y components, each plot with all four selected loadsteps, or in this case shear on one plot and moment on another plot for all four selected loadsteps. The results of this layout option are shown in the second picture, following. Try both options.
| 13. | Click Apply to generate the shear moment plots. |
These plots can be used with traditional mechanics of materials calculations such as S = My/I and T = VQ/IT to calculate stresses for various cross-sections. The plots provide the M (bending or Mz) and V (shear or Fy) values to these equations which when coupled with cross-section properties which can be calculated using HyperBeam (from the main menu, select the1D page, then select HyperBeam), allows for the calculation of the cross-section stresses.
Exercise 2: Extracting Free Body Diagrams from Global Loads Model and Transferring to Detailed Model as Boundary Conditions – Submodeling Techniques
This exercise uses the model file, icw_ex2.hm.
Step 1: Extract free body diagrams for Spar2 using FBD Forces utility.
| 1. | If continuing from Exercise 1, proceed; otherwise open HyperMesh and load the model file, icw_ex2.hm. |
| 2. | From the menu bar select Post > Free Body > Force to open the FBD Forces tab. |
| 3. | If the icw.op2 file is currently loaded, proceed; otherwise, from the .op2 file: browser, select icw.op2. |
The selected .op2 file loads into the HyperMesh database for use with all FBD utilities until another .op2 file is selected. It also populates the Subcases list box with all subcases in the selected .op2 file that contain Grid Point Force (GPFORCE) data. See the FBD documentation in the HyperMesh User's Guide for more details.
| 4. | In the Loadsteps list, select SUBCASE 9, SUBCASE 11, SUBCASE 14, and SUBCASE 16, the critical subcases determined in Exercise 1, Step 5. |
| 5. | In the Entity selection area, click Element Set twice. |
| 6. | Click set, then select the Spar2 element set. |
Elements that represent Spar2 are now displayed in the graphics area. To turn on element shading, click Shaded Elements and Mesh Lines ( ).
).
| 8. | Click Result System twice. |
The graphic area is updated with all systems in the model.
| 9. | Select the system located at the left-middle end of Spar2 (system 102 created in Exercise 1, Step 1), and click proceed. |
Note: You may have to display the Longeron2 system collector from the Model Browser to display system 102.
The result system is the system for which all free body force and moment result vectors will be transformed into and output.
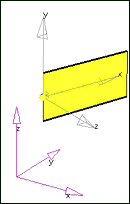
| 10. | Click Summation Node twice, select the left-bottom node, and then click proceed. |
This summation node is the node for which all free body force and moment vector results will be summed about to generate a single equivalent resultant force and moment vector. Note that for a free body (all loads), the summation about any point must be zero. Therefore, this feature is typically used to verify that the extraction produced a free body with zero summation. However, if a free body other than (all loads) is performed, the selection of the summation node can be used to determine the equivalent resultant force and moment vector for the extracted free body (applied load only or reaction loads only) which in general will not be zero and can be of interest.
Review the following table for a description of the Output options for the FBD Forces utility.
Output Function
|
Description
|
FBD type
|
Defines the types of grid point forces (GPFORCE) to consider in the free body extraction. GPFORCE data available at any given node includes, element, applied, SPC, and MPC forces. FBD types include; All loads (which considers all GPFORCE data), Applied loads only (which only considers applied forces only), and Reaction loads only (which considers SPC and MPC forces only).
|
Zero tolerance
|
Defines any number less than this number is set to zero for numerical issues.
|
Create load collectors
|
Creates load collectors containing the results of the FBD force calculations so that the results can be visualized in the graphics area as force and moment vectors.
|
Show summary table
|
This option brings up a window with formatted results similar to the .csv (comma separated)file. Use this output for quick checks of the data without having to open an alternative spreadsheet or text editor program.
|
Create .csv file
|
Creates a .csv file with the results of the resultant force and moment calculations, which can be opened directly within any standard spreadsheet applications.
|
| 11. | For FBD type, select All Loads. |
| 12. | For Zero tolerance, type 0.01. |
| 13. | Activate Create load collectors and optionally select a default color for the created load collectors. |
| 14. | Activate Show summary table. |
| 15. | Activate Create .csv file, browse to the desired location, and type icw_fbd_force.csv. |
| 16. | Click Accept to execute the FBD forces calculations for all selected subcases. |
The FBD Forces Output Summary window displays the FBD forces calculations (see following image). There is a separate data block grouped by loadstep. The data block contains free body nodal forces, moments, and the sum of those nodal forces and moments about the defined sum node. Note that the sum of the moment components (Mx, My, Mz) for each node is not the direct sum as the (rXF) terms for the force resultant vector about the sum node must also be added to each moment component appropriately. The sum of the forces components (Fx, Fy, Fz) for each node is, however, the simple sum. In addition, the sum for a Free Body – All Loads result should be, and is, zero about any sum node selected. You can verify this with the SUM line at the bottom of each data block. For other FBD types, however, the sum about the sum node may or may not be zero, depending on the selections.
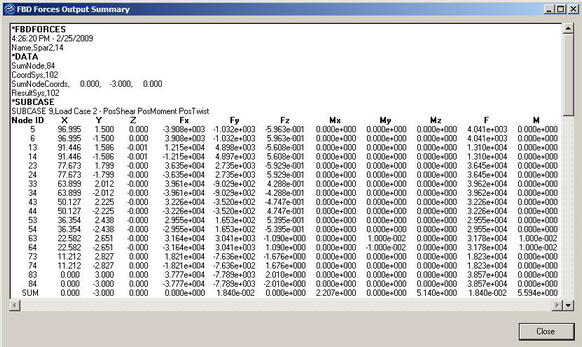
| 17. | (Optional) Open the icw_fbd_forces.csv file directly with Microsoft Excel by double-clicking the file in Windows Explorer. This file contains the same results as the summary table in the previous image, but is available for import into standard spreadsheet or text editor programs. |
| 18. | Click Close to exit the FBD Forces utility. |
Vector review of the FBD forces results in the graphics area is covered in the next step.
Step 2: Use FBD Results Manager to review FBD force vectors in graphics area.
| 1. | From the menu bar, select Post, then Free Body Results Manager to open the FBD Results Manager tab. |
| 2. | Click Element Set twice. |
| 3. | Click set, then check Spar2. |
| 6. | (Optional) Activate the Show model check box to display the entire model with the selected element set highlighted in red and all other elements transparent. This feature will help you easily locate the element set within the model. |
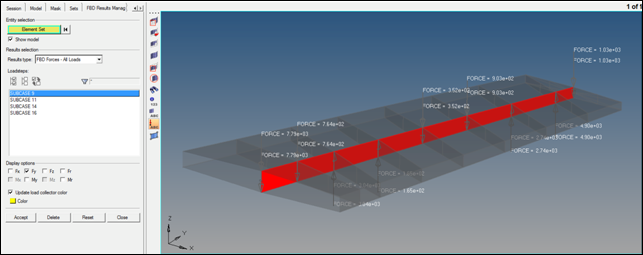
| 7. | For Results type, select FBD Forces – All Loads. |
This operation scans the database for available loadsteps with FBD Forces – All Loads results and populates the Loadsteps list box.
| 8. | For Loadsteps, select SUBCASE 9. |
This operation will scan the database for available force and moment vector results and will enable the check boxes for those force and moment vectors that are available.
| 9. | For Display options, select Fy (shear—the results coordinate system had y-axis in the plane of the web). |
To determine the result coordinate system applied to a given cross-section of interest, use FBD Cross-Section Manager to review the defined cross-section. This operation will show the element set, node set, results system, and sum node defined for the selected cross-section. Optionally, select other force components to review their magnitude and direction in the graphics area. Single or multiple force and moment vector results can be displayed in the graphics area to facilitate data mining and reporting.
| 10. | (Optional) Select Update load collector color and select color to change the color of the selected load vectors. |
The new color setting applies only to the load components selected and are saved in the database. Therefore, this option can be used to recolor any single or multiple load vectors for any FBD result.
| 11. | Click Accept to make visible the FBD force vectors in the graphics area. |
| 12. | (Optional) Continue to review FBD Forces – All Load vector results following steps 2.6 – 2.13 for additional loadsteps and force/moment components. |
| 13. | Click Reset to clear the display and reset the form. |
| 14. | Click Close to exit the FBD Results Manager utility. |
Step 3: Use FBD Export Manager to export FBD Forces to .fem file.
| 1. | From the menu bar, select Post, then Free Body Export Manager to open the FBD Export Manger tab. |
| 2. | Click Element Set twice. |
| 3. | Click set, then select Spar2. |
| 5. | For Results type, select FBD Forces – All Loads. |
This operation scans the database for available loadsteps with FBD Forces – All Loads results and populates the Loadsteps list box.
| 6. | For Loadsteps, Select SUBCASE 9, SUBCASE 11, SUBCASE 14, SUBCASE 16. |
| 7. | Check the options for Create appropriate loadsteps, and for Output file, browse to the desired location and enter spar2_fbd_forces.fem. |
This operation turns on the display of all load collectors associated with the currently selected FBD result type for all selected loadsteps. Additional loadsteps can be selected and accepted, which will append to the current display on each click of accept. In addition, a new element set or FBD result type can be selected and appended to the current display on each click of accept. To clear the display click Reset.
This operation will export the currently displayed loads and all other associated/required cards to the output file selected. This file can subsequently be imported into another HyperMesh database (typically called the detailed model) and the loads contained therein can be "attached" to the structure of the detailed model as boundary conditions with the addition of a rigid body constraint. This process will be carried out in the next step.
This operation clears the current display.
11. Click Close to exit the FBD Export Manager utility.
| 12. | (Optional) On the File menu, click Save as…, and save the HyperMesh database as icw_final.hm. |
| 13. | From the menu bar, select File, then Exit to exit HyperMesh. |
Step 4: Import FBD forces from .fem file into detailed model and solve.
| 1. | Load the model file, spar2_ex2.hm. |
| 2. | From the menu bar, select File > Import > Solver Deck to open the Import tab. |
| 3. | Select File type: OptiStruct, and browse for file: spar2_fbd_forces.fem. |
This operation imports the free body loads from the global model into the detailed model of Spar2. The next process is to "attach" the free body loads to the detailed model, perform some clean-up operations, define new loadsteps with the free body loads and a rigid body constraint, and solve the detailed model. This process will be accomplished in the remainder of this step.
| 5. | From the menu bar, select Mesh, then Check, then Nodes, then Equivalence to go to the Edges panel. |
The nodes of the imported loads are equivalenced with those of the detailed model which are overlaying each other as a consequence of importing the free body loads.
| 6. | Toggle the selector from comps to elems. |
| 7. | Click elems >> displayed. |
Eighteen nodes should be found, one at each load.
| 9. | Click equivalence to combine nodes that were imported and attached to the loads with those that are a part of the detailed mesh of Spar2. |
| Note: | When the detailed Spar2 mesh was constructed, attention to where these interface nodes were located was taken into account by placing fixed points on the surfaces at these locations. The fixed points maintain a node at that location from the automesher and thus guarantee that a node will exist where a load is located. This method is only one of several potential methods. Other options could include importing the loads which do not line up with any other nodes in the detailed mesh and then connecting the loads to the detailed mesh with R-type elements (RBE2 or RBE3). Several other possibilities could also exist and best methods and practices should be considered depending on the problem type. |
| 10. | Click return to exit the Edges panel. |
| 11. | Click Delete  to open the Delete panel. to open the Delete panel. |
| 15. | Click delete entity to delete the TempMass component entity. |
| 16. | Click return to exit the Delete panel. |
| 17. | On the Model tab, select the LoadCollector folder, right-click to bring up the context menu, and select Hide to remove all loads from the graphics area. |
| 18. | To define a rigid body constraint perform the following: |
| • | Create a load collector for the rigid body constraint definition. From the menu bar, select Collectors, then Create, then Load Collectors to to open the Create Load Collector dialog box. |
| • | In the Name field enter Const. |
| Note: | This operation sets the current load collector to the newly created Const load collector. The current load collector is the collector which any newly created load (constrains in this case) are placed into. |
| • | Assign an analysis system to the nodes for which the rigid body constraint will be applied. From the menu bar, select Mesh, then Assign, then Node Analysis System to go to the Systems: Assign subpanel. |
| • | Select the three nodes highlighted in the following image. |
| • | Select system 102 on left-middle end (x-axis along length, y-axis along web, z-axis normal to web). |
| Note: | You may have to display the Longeron2 system collector from the Model browser (Model tab) to display system 102. |
| • | Click return to exit the Systems panel. |
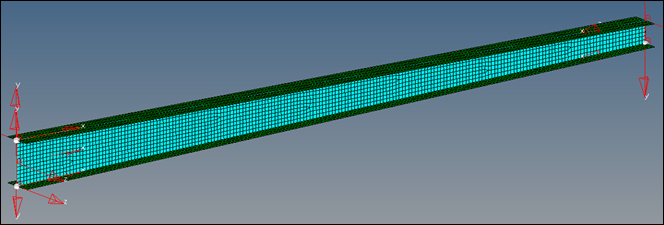
| • | Assign a constraint to left-bottom node. From the menu bar, select BCs, then Create, then Constraints to go to the Constraints panel. |
| • | Select the left-bottom node. |
| • | Select dof1, dof2, and dof3. |
Make sure all other dofs are unselected.
| • | Select the left-top node. |
Make sure all other dofs are unselected.
| • | Select the right-bottom node. |
Make sure all other dofs are unselected.
| • | Click return to exit the Constraints panel. |
| 19. | To update the loadsteps for all four free body load cases, perform the following: |
| • | From the menu bar, select Setup, then Edit, then LoadSteps to go to the LoadSteps panel. |
| • | Click name = and select SUBCASE 9. |
| • | Toggle type to linear static. |
| • | Select SPC, click =, and select Const load collector. |
| • | Repeat steps for SUBCASE 11, SUBCASE 14, and SUBCASE 16. |
| 20. | From the menu bar, select Setup > Create > Control Cards to go to the Control Cards panel. |
| 22. | For number_of_formats enter 2, and then hit ENTER on the keyboard. |
There are now two FORMAT buttons.
| 23. | Click each FORMAT button and set them to HM and OUTPUT2, respectively. |
| 24. | Click return to specify output file formats for HyperMesh .res (HM) and .op2 which can be used in HyperView to post-process the results. |
| 25. | Click GLOBAL_OUTPUT_REQUEST |
| 26. | Click DISPLACEMENT and STRESS. |
| 27. | Click return to request displacement output for both output formats. |
| 28. | Click return to exit the Control Cards panel. |
| 29. | From the menu bar, select File > Save As…, and save the model as spar2_ex2_analysis.hm. |
| 30. | From the Analysis page, click OptiStruct to run the model. |
| 31. | For run options, toggle to analysis. |
| 32. | For export options, toggle to all. |
| 33. | Click OptiStruct to export the solver deck and run the analysis in OptiStruct. If –optiskip appears in the options field, clear the field before clicking OptiStruct. |
| 34. | Once OptiStruct finishes, click return to exit the OptiStruct panel. |
| 35. | In the Post menu, click Deformed panel and review the results of the analysis. |
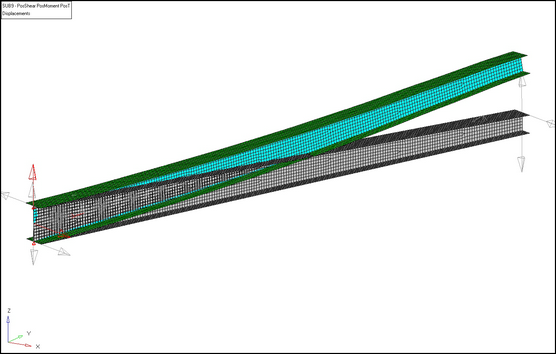
| 36. | Click Simulation = and select SUB9 – PosShear PosMoment PosT. |
| 37. | Click data type = and select Displacements. |
| 38. | Click deform to produce the deformed shape of Spar2 in the graphics area for the selected simulation. |
| 39. | Click return to exit the Deformed panel. |
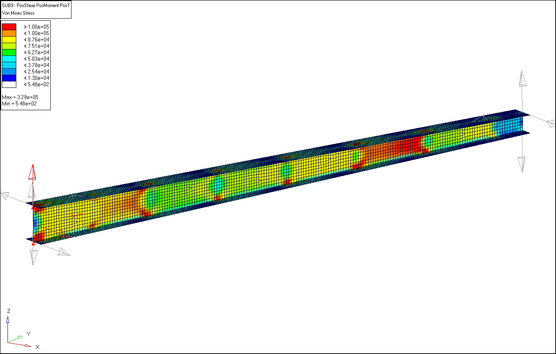
| 40. | In the Post menu, click contour to go to the Contour panel and review the results of analysis. |
| 41. | Click Simulation = and select SUB9 – PosShear PosMoment PosT. |
| 42. | Click data type = and select Von Mises Stress. |
| 43. | Select the legend subpanel. |
| 44. | Toggle find maximum to maximum = and enter 100000. |
| 45. | Click contour to produce the contour plot in the graphics area. |
| 46. | (Optional) Continue to use the contour panel to review additional results. |
| 47. | Click return to exit the Contour panel. |
| 48. | (Optional) From the menu bar, select File, then Save. |
This operation saves the current HyperMesh database, spar2_ex2_analysis.hm.
| 49. | From the menu bar, select File, then Exit to exit HyperMesh. |
See Also:
HyperMesh Tutorials


![]() ).
).


