In this tutorial you will learn how to link variables of a model to output responses of other models. The input variables are the thickness of each of the three components, defined in the input deck via the PSHELL card. The thickness should be between 0.05 and 0.15; the initial thickness is 0.1 (shown below).
The sample base input template files used in this tutorial can be found in <hst.zip>/HS-1060/. Copy the file from this directory to your working directory.
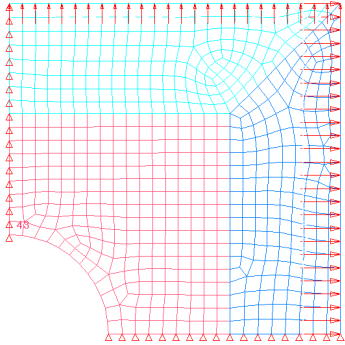
Figure 1: Double Symmetric Plate Model
| 2. | To start a new study, click File > New from the menu bar, or click  on the toolbar. on the toolbar. |
| 3. | In the HyperStudy – Add dialog, enter a study name, select a location for the study, and click OK. |
| 4. | Go to the Define Models step. |
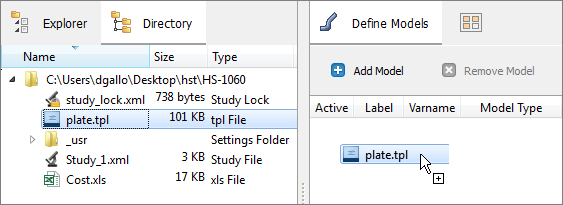
| 5. | Add a Parameterized File model. |
| a. | From the Directory, drag-and-drop the plate.tpl file into the work area. |
| b. | In the Solver input file column, enter plate.fem. This is the name of the solver input file HyperStudy writes during any evaluation. |
| c. | In the Solver execution script column, select OptiStruct (os). |
| 6. | Add a Spreadsheet model by dragging-and-dropping Cost.xls file from the Directory into the work area. |
The Resource, Solver input file, and Solver input arguments fields become populated. The Solver input file field displays hst_input.hstp, this is the name of the solver input file HyperStudy writes during an evaluation.
| Note: | When you create an Excel spreadsheet model, it is important that you format it correctly. A variable's value and label can be formatted in two consecutive rows or two consecutive columns. Variable labels should only contain English characters, or a combination of English characters and numbers. If you do not create a label for a variable, HyperStudy will assign one by default. |

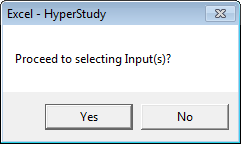
| 7. | Click Import Variables. The cost.xls spreadsheet opens. |
| a. | In the Excel - HyperStudy dialog, click Yes to begin selecting input variables. |
| b. | In the spreadsheet, select the cells that contain the input variable's labels and values. |
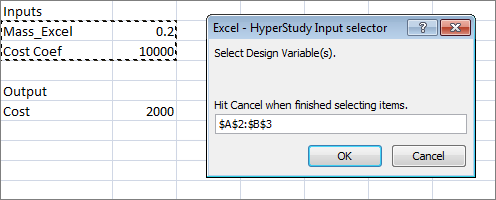
| c. | In the Excel - HyperStudy Input selector dialog, click OK. |
| d. | Click Cancel to stop selecting input variables. |
| a. | In the Excel - HyperStudy dialog, click Yes to begin selecting output responses. |
| b. | In the spreadsheet, select the cells that contain the output response's label and value. |
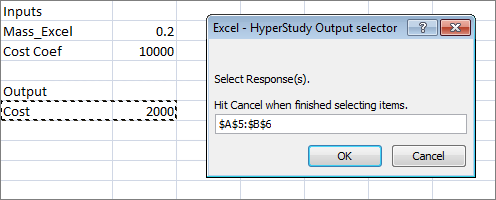
| c. | In the Excel - HyperStudy Output selector dialog, click OK. |
| d. | Click Cancel to stop selecting output responses. Two input variables and one output response are imported from the cost.xls spreadsheet. |
| 10. | Go to the Define Input Variables step. |
| 11. | Review the input variable's upper and lower bound ranges. |
| 12. | Go to the Specifications step. |
|
| 1. | In the work area, set the Mode to Nominal Run. |
| 3. | Go to the Evaluate step. |
| 5. | Go to the Define Output Responses step. |
|
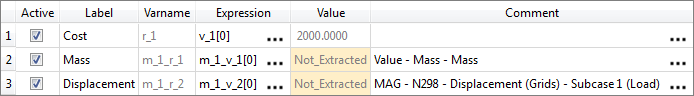
In this step you will create two output responses: Mass and Displacement.
| 1. | Create the Mass output response. |
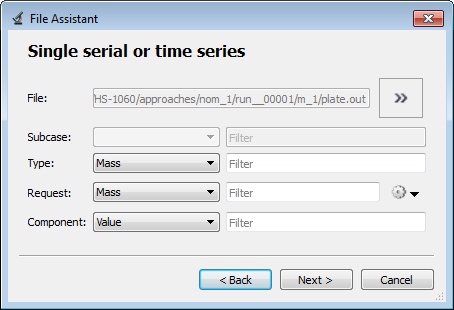
| a. | From the Directory, drag-and-drop the plate.out file, located in approaches/nom_1/run_00001/m_1, into the work area. |
| b. | In the File Assistant dialog, set the Reading technology to Altair® HyperWorks® and click Next. |
| c. | Select Single item in a time series, then click Next. |
| d. | Define the following options, and then click Next. |
| e. | Label the output response Mass. |
| f. | Set Expression to First Element. |
| Note: | Because there is only a single value in this vector, [0] is inserted after v_1, thereby choosing the first (and only) entry in the vector. |
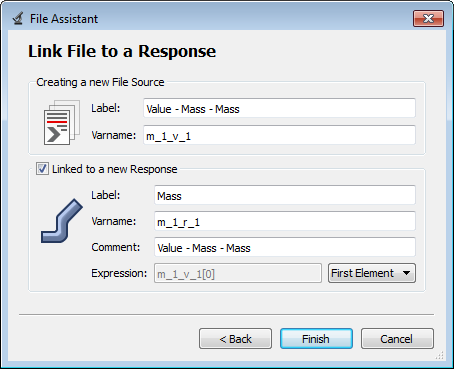
| g. | Click Finish. The Mass output response is displayed in the work area. |
| 2. | Create the Displacement output response. |
| a. | From the Directory, drag-and-drop the plate.h3d file, located in approaches/nom_1/run_00001/m_1, into the work area. |
| b. | In the File Assistant dialog, set the Reading technology to Altair® HyperWorks® and click Next. |
| c. | Select Single item in a time series, then click Next. |
| d. | Define the following options, and then click Next. |
| • | Set Subcase to Subcase 1 (Load). |
| • | Set Type to Displacement (Grids). |
| e. | Label the output response Displacement. |
| f. | Set Expression to First Element. |
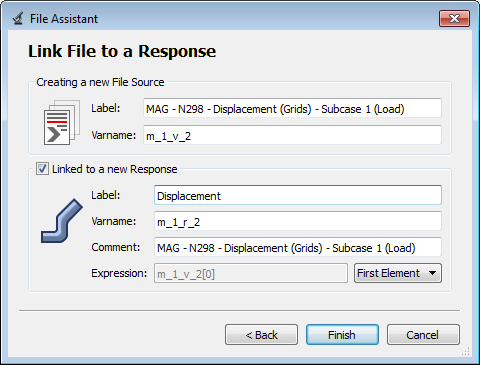
| g. | Click Finish. The Displacement output response is added to the work area. |
| 3. | Click Evaluate to extract the output response values. |
|
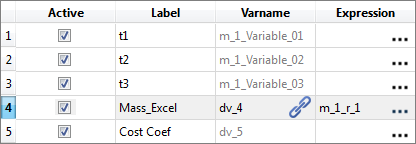
| 1. | In the Explorer, click Define Input Variables. |
| 3. | In the Expression column of the input variable Mass_Excel, click  . . |
| 4. | In the Expression Builder, click the Responses tab. |
| 5. | Select the output response Mass. |
| 6. | Click Insert Varname. The expression m_1_r_1 appears in the Evaluate Expression field. |
| 7. | Click OK. The input variable Mass_Excel of Model 2 is now linked to the output response Mass of Model 1. |
| 8. | Go to the Specifications step. |
| 9. | In the work area, set the Mode to System Bounds Check. |
| 11. | Go to the Evaluate step. |
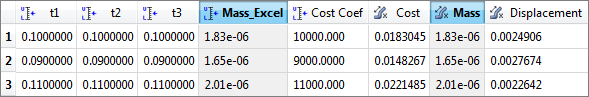
| 13. | Click the Evaluation Data tab. |
| 14. | Verify that the input variable Mass_Excel is equal to the output response Mass. |
|
See Also:
HyperStudy Tutorials


