Complex Results |

|

|

|

|
|
Complex Results |

|

|

|

|
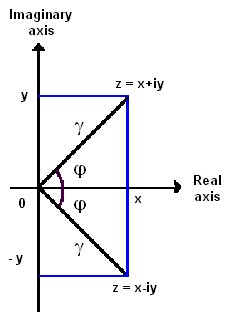
Results in some analysis types come as complex numbers. A complex number z consists of a real and imaginary part, and can be written (in Cartesian format) as:
z = x + iy
Where:
x is the real part of z.
y is the imaginary part of z.

Complex number can also be written in the polar format:
![]()
where
![]() , is the magnitude of z.
, is the magnitude of z.
and
![]() , is the phase of z.
, is the phase of z.
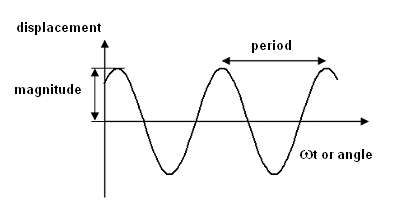
A response of a point under sinusoidal excitation (oscillation) can be described as:

![]()
Where ![]() , is the angular velocity and t is time. In HyperView, you can select the increment of ωt (called "angle") from the Animation Controls panel.
, is the angular velocity and t is time. In HyperView, you can select the increment of ωt (called "angle") from the Animation Controls panel.
When a complex result is loaded, HyperView will automatically switch to modal animation mode ![]() .
.

Contour panel with complex results
In modal animation mode, there is selection to choose a complex filter.
The available complex filters are:
| mag * cos (ωt- phase) | the response with varying angle or ωt (in degree). |
| mag | magnitude (r) of the complex result |
| phase | phase |
| real | real part (x) of the complex number |
| imaginary | imaginary part (y) of the complex number |
Other functionalities can be viewed in Contour panel.
To view the contour of complex response at certain angle:
| • | Go to the Animation Controls panel, input the angle under current angle entry and click enter. |
To view the contour animation of complex response:
| • | Go to the Animation Controls panel |
Complex results of invariants of a vector (like magnitude of displacement) or a tensor (like von-Mises value of stress) can only be calculated at a specific angle from the response of each components at that angle. For example, complex responses of x, y and z components of displacement are:
![]()
![]()
![]()
For a specific angle ωt, the magnitude of displacement is calculated as:
![]()
Note that the response of an invariant is not a complex number. It can only be calculated at a specific angle. When an invariant is selected for modal animation, HyperView calculate the value at each specified angle increment for each response point separately.
You can view the curve plot from the Measure panel.