| 1. | From the Contour panel Result type drop-down menu  , select the data type that should be used to calculate the contours (for example: Displacement (v), Stress (t), 1D stress, Energy (s), etc.). The available options will change depending on the currently loaded result file. , select the data type that should be used to calculate the contours (for example: Displacement (v), Stress (t), 1D stress, Energy (s), etc.). The available options will change depending on the currently loaded result file. |
| 2. | Select the data component from the second drop-down menu below Result type  . . |

The list of available components is based on the selected result type, for example:
Result type
|
Component options
|
Displacement (v)
|
Mag, X, Y, or Z
|
Stress (t)
|
vonMises, Signed vonMises, P1(major), P2(mid), P3(minor), MaxShear, Intensity, Pressure, In-plane P1(major),
In-plane P2(minor), XX, YY, ZZ, XY, YZ, or ZX
|
1D stress
|
Multiple options are listed for various elements such as: CELAS, CROD, CBAR, CBEAM, etc.
|
Energy (s)
|
No component selection is necessary.
|
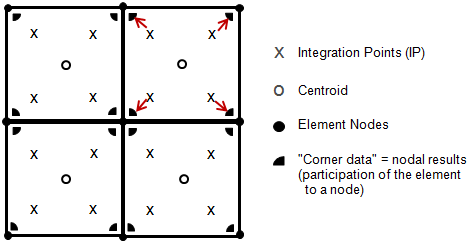
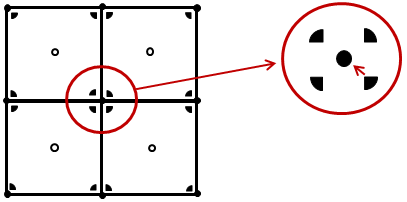
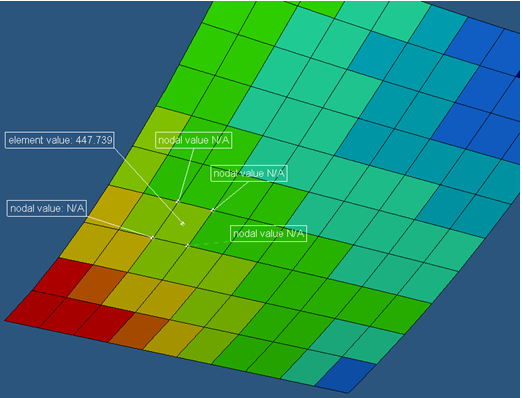
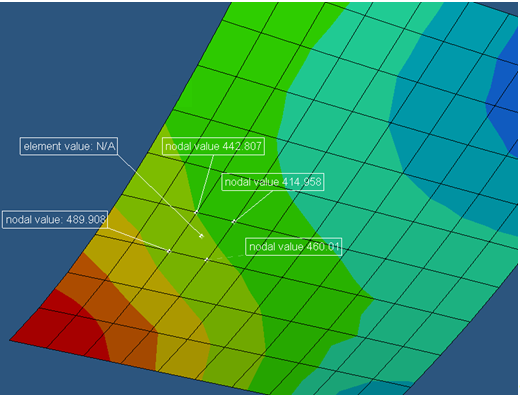
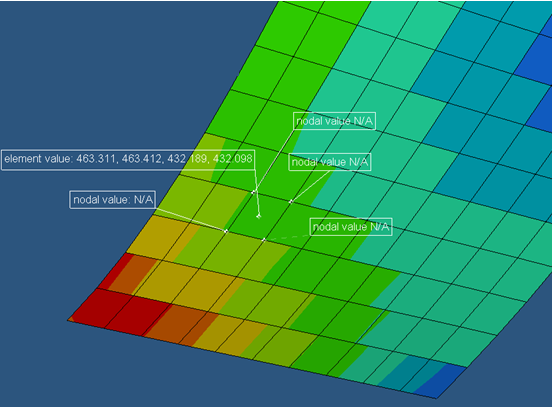
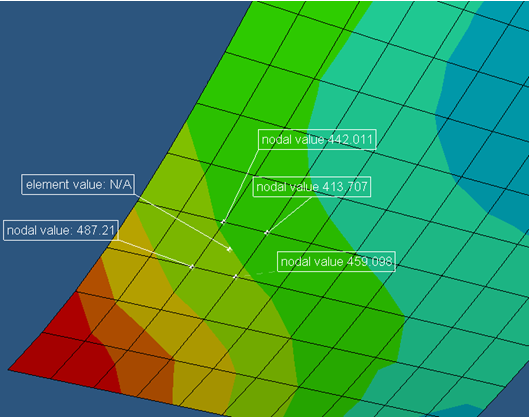
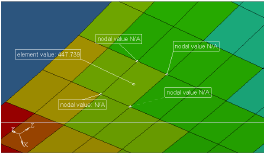
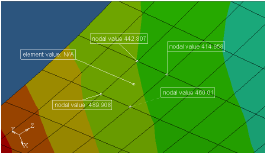
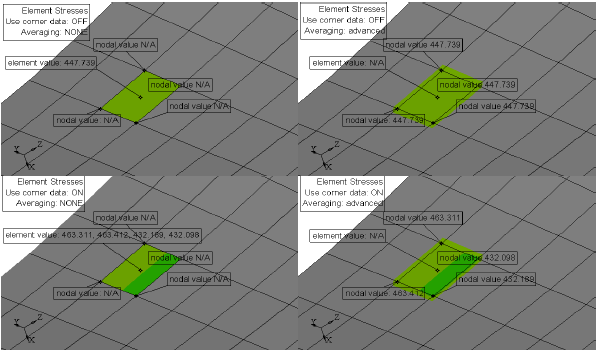
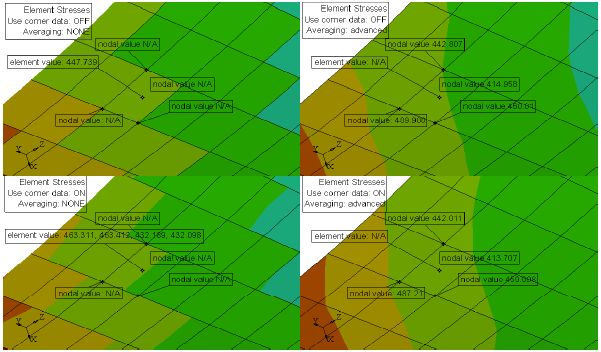
| 3. | If corner data is available, choose if an nodal or element value should be used by checking/unchecking the Use corner data option  (see the element stress examples below). (see the element stress examples below). |
|
Averaging: None
|
Averaging: Simple/Advanced
|
Use corner data off
|
One value per element: centroid value taken from result file.
|
One nodal value for all corresponding elements: averaged from each
centroid value.
|
Use corner data on
|
IP value mapped to nearest node,
OR, the Nodal result from result file (whichever of the two is available): values are not averaged at node.
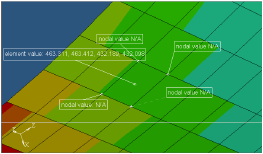
|
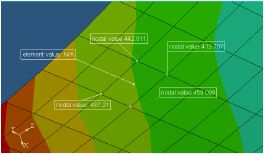
One nodal value for all corresponding elements: averaged using corresponding corner data values (either IP or nodal result from result file).
|
| 4. | For Selection, pick one or more entities from the model. |
| 5. | For Resolved in, select the coordinate system that will be used to calculate the results. |
| - | If User System is selected, use the System input collector to select a system by ID. |
| 6. | Use the Averaging method drop-down menu  to select the averaging type of the element contribution at the shared element node (see the element stress examples below). to select the averaging type of the element contribution at the shared element node (see the element stress examples below). |
Only one element contoured: Averaging at nodes with values from that element.
Values that are averaged at nodes have contributions from all of the attached elements.
| 7. | For Use variation (%), enter a percentage for the variation range. |
| 8. | Activate the relevant check boxes for Display options, Legend threshold, and Result display control. |
| 9. | Click Apply. The contour plot is displayed. |
For Abaqus .odb files
The following results are available from *.odb files:
| • | Integration point values: S-Stress component or S-Stress component IP (Integration Points), depending on the result type. |
| • | Nodal results: S-Stress component or S-Stress component IP (Integration Points), depending on the result type. |

|
Averaging: None
|
Averaging: Simple/Advanced
|
Use corner data off
|
One value per element: centroid value taken from result file.
|
One nodal value for all corresponding elements: averaged from each centroid value.
|
Use corner data on
|
IP value mapped to nearest node
(S-Stress Components IP)
OR
Nodal result from result file
(S-Stress Component)
In both cases, values are not averaged at node.
|
One nodal value for all corresponding elements averaged using corresponding corner data values:
IP value (S-Stress Component IP)
OR
Nodal result (S-Stress Component) from the result file.
|
For *.op2 and *.h3d results

SHELL elements Solver output default - values are available at the centroid:
| • | Use corner data option is not available. |
| • | Averaging can be done on centroidal results (None, Simple, or Advanced). |
When CORNER, BILIN, or CUBIC have been called in the solver - nodal results will be available in the result file for each element:
| • | Use Corner Data option is available. |
| • | Corner data = nodal results are taken directly from the result file. |
| • | Averaging can be done in HyperView on the values taken from the result file. |
|


