Query Panel |

|

|

|

|
|
Query Panel |

|

|

|

|
The Query panel allows you to view and export properties and other information for nodes, elements, components, and systems contained in the active model.
To access the Query panel, click on the Query button ![]() on the Results toolbar, or select Query from the Results menu.
on the Results toolbar, or select Query from the Results menu.

Query panel
To query entities in the active model: define a selection set using the input collector or by picking entities directly on the model (the selected entities are highlighted in the graphics area), check categories in the list, and click the Apply button. The requested information is displayed in a table . The cells within the table are disabled and cannot be changed. However, you can copy and paste highlighted cells into other programs using CTRL + C and CTRL + V for copy and paste, respectively.
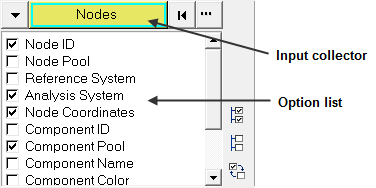
The input collector and the option list allow you to define the selection set to be queried.
Input Collector |
The input collector allows you to define a selection set for which you would like to display information. |
Option List |
Below the input collector and on the left-most side of the panel is the option list. You can activate the check box next to the information you would like displayed in the table. |

The options available in the option list change, depending on the current input collector. They include:
Model Identifier |
Displays the source of the data in the table. For instance, p1w1m1 means that the data comes from model 1, which is located on page 1 in window 1. This option is for all entities. |
||||||
Nodes |
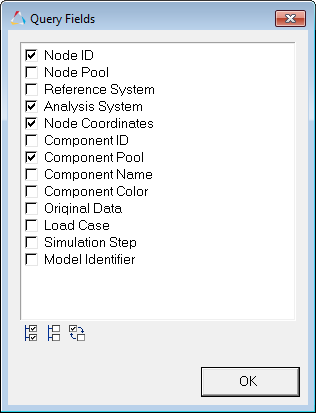
Node ID, Node Pool, Reference System, Analysis System, Node Coordinates, Node Coordinates (Tracked), Component ID, Component Pool, Component Name, Component Color, Original Data, Load Case, and Simulation Step. Note - The Node Coordinates (Tracked) query field will output the node coordinates relative to the tracking system.
Note - For MinLayer/MaxLayer/ExtremeLayer, the query will return the layer name and the value. |
||||||
Elements |
Element ID, Element Pool, Element Config, Element Connectivity, Element Normal, Element Centroid, Component ID, Component Pool, Component name, Component Color, Load Case, and Simulation Step. The Contour (value) and Contour Resolved-In System options are available if a contour has been applied to elements for centroid or corner results. The Tensor (value) and Tensor Resolved-In System options are available if a tensor plot has been generated at the element centroid. Note - For MinLayer/MaxLayer/ExtremeLayer, the query will return the layer name and the value. |
||||||
Components |
Component ID, Component Pool, Component name, Component Color, Load Case, and Simulation Step. Contour Min/Max, Min/Max ID, Max ID's Pool Name, Min ID's Pool Name, and Contour Resolved-In System options are available if a contour has been applied. Vector/Tensor Min/Max, Min/Max ID, and Resolved-In System options are available if a vector or tensor plot has been generated. Note - For MinLayer/MaxLayer/ExtremeLayer, the query will return the layer name and the value. |
||||||
Systems |
System ID, System Pool, System Type, Origin Coordinates, X axis, Y axis, and Z axis. |
Click the expansion button, |

Query Fields dialog
Query options can also be selected, or deselected, using the All/None/Reverse buttons:
|
All options listed are selected. |
|
No options listed are selected. |
|
Current selection status is reversed. |
The following options allow you to generate, manage, and export query data.
Remove duplicates |
Removes all duplicates from the queried nodal data. This option is enabled when either:
OR
Note - This option is disabled for all query entity types other than node. |
||||
Apply |
After you click Apply, the requested data is displayed in the table. The number and content of the columns in the table depend on the fields selected in the option list on the left side of the panel, For example, if only the ID and Coordinates options are checked, then only those two columns are displayed in the table. |
||||
Clear Table |
Clears all data in the table, but does not clear the selection set defined using the input collector. |
||||
Export |
Click Export to display the Output File dialog, which allows you to save the contents of the table to a text file. The initial directory displayed is the present working directory, and the default file name "result" is provided. If you want to open the file in Excel, save the file with a .csv extension. |
||||
Advanced… |
Click Advanced… to display the Advanced Query dialog. From this dialog you can input additional query options.
|
In addition, you can access the following options by right-clicking anywhere within the table:

Copy |
Copies all the data from the row(s) selected in the table to the clipboard. |
|
Select |
||
All |
All rows in the table are selected and their corresponding entities are highlighted in the graphics area. |
|
None |
No rows in the table are selected and their corresponding entities are no longer highlighted in the graphics area. |
|
Reverse |
Current selection status is reversed. |
|
Delete |
Deletes all rows that are selected in the table. |
|
| Note | You can also sort the data in the table by clicking on one of the selected option headings. |
The reset switch,
The requested information is displayed in the query table.
|
The Output File dialog is displayed.
If you want to open the file in Excel, give the file a .csv extension.
|
If a .csv file created from a HyperView table is imported directly into Excel, the data may not be imported into the columns correctly. HyperView exports the various data (vector for example) together into one field, as seen in the example below:
To import the data into separate columns:
This allows you to separate the vector field into three columns.
|
See also