Highlights
The HyperGraph Plot browser is updated with a new string-based filter, which supports keyword-based searches and Boolean operations. This allows filtering using entity properties of curves, axis, etc. in combination with newly introduced page and window properties. Particularly, the editing of large session files will become much easier. Drag & drop has been added to the plot browser for faster repositioning of curves, together with new context menus to isolate / reverse-isolate curves.
CSV files can be loaded as documents in TableView so that they appear as parameters in report templates, similar to the open document feature in TextView. Using overlay areas in TableView allows the user to append rows or columns with cell values from CSV files by overlaying report templates.
PowerPoint Publishing allows more control with respect to defining the size of the exported images or movies on Windows. As was implemented for LINUX in the previous release, an algorithm was added to keep the image aspect ratio when synchronizing modified PowerPoint presentations. New APIs are added which allow customization of all PPT Publishing features.
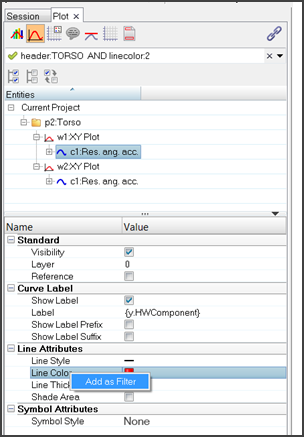
| • | String-Based Filtering: The string-based filter functionality allows the user to add keyword-based searches and Boolean operations; braces can be used to modify the search string. Keywords and search values for all entity properties can be graphically added by using the context menu in the property tables. Previous searches are stored in the drop down list and can be reused within the current session. The combination of entity and page/window properties make it much easier to handle large files. Typical examples would be searching for all horizontal axes in XY plots, and ignoring bar charts and complex plots |
| • | Drag & Drop: The Plot browser curve view now supports dragging and dropping of curves, which is a faster way to perform the existing cut-paste feature. This allows easy positioning of multiple curves behind a dedicated curve, which was previously only possible for single curves in the Define Curves panel. |
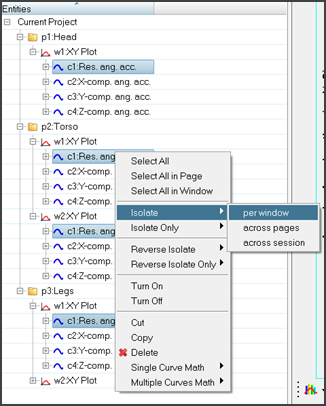
| • | Isolate/Reverse-Isolate: Similar to HyperView, the Plot browser now allows isolate / reverse-isolate only in the curve view. Because the Plot browser allows selections over multiple pages and windows, the options “per window”, “across pages” and “across session” are added. Using “per window” will only isolate curves in windows where at least one curve is selected; all the other windows will not be affected. “Across page” works similarly for the entire page. If the user wants show only the selected curves for the whole session, “across session” needs to be selected. Isolate only will show only the curves; all other entities (notes, axes, headers etc.) will be hidden |
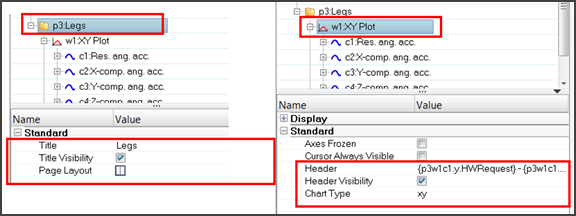
| • | Page / Window Properties: The following new page and window properties are accessible in all views of the Plot browser and can be used for filtering: |
|
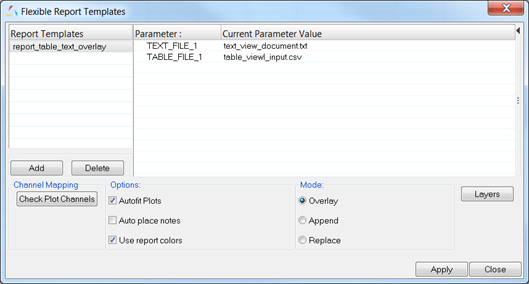
By loading CSV files via File > Open > Document into TableView, a link to the Excel file is saved to the session file or the report template. Changes to formatting (borders or fonts, for example) and any conditional formatting rules that you have defined in TableView are restored when you reopen the session file or report template; only the values will be updated from the linked CSV file. Using overlay areas in report templates allow the user to overlay multiple times and append rows/columns in which the cells are formatted according to the same rules used at the first import.
|
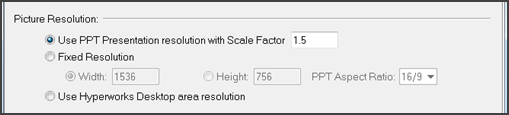
On Windows, two more options to define the picture resolution have been added. Using the newly-added scale factor to the PPT Presentation resolution, which was the default in 14.0.110, makes it easy to control the proportion of text/labels in axes and legends in relation to the images in the PowerPoint presentation.
Using the Fixed Resolution allows the user to define either the image height or width and the aspect ratio of the PPT master template. The PPT Publishing ensures that, for syncing, the image dimensions will be the same in PPT as long as the user uses the same settings saved by HWD at the time of the initial export.
The HyperWorks Desktop area resolution captures the images as they are displayed on the screen and fits them proportionally into the PowerPoint window with the first export, maintaining the aspect ratio.
|
| • | Support of NODOUTHF and ELOUTHF ASCII files from LS-DYNA |
|
| • | The unit support for the HIC function in the VST Pedestrian Impact tool has been fixed; the values are no longer zero. |
| • | For some NASTRAN-generated PCH files with line numbers, the imaginary values were wrong. This bug has been fixed. |
| • | The filtering for horizontal or vertical axes in combination with the plot type has been improved. |
| • | The page title will now only be updated the first time a curve is loaded via the Build Plots panel; in previous versions, changes made in the page title where overwritten. |
| • | Line segments in Bar Chart lines are now displayed even when they are partly outside of the GUI. |
| • | PPT Publishing offers new features to control both the font size of legends/labels and the aspect ratio of the exported images (see above for details). |
| • | In PPT Publishing, broken links to images or text fields are again displayed in red when using the “View Names” feature in the ALTAIR PowerPoint plug-in. This feature was broken in previous versions. |
| • | Reading SECFORC *DATABASE_CROSS_SECTION group results from LS-DYNA BINOUT files no longer show random numbers instead of the section name as requests in the Build Plots panel. |
| • | Missing documentation for the Flexible Report APIs has been added. |
| • | Copying and pasting pages or windows no longer changes the axis units for Dyna result files. |
|


