Highlights
Video enhancements in MediaView allow the user to adapt brightness, contrast, gamma correction and edge enhancement. The KTH (Knee-Thigh-Hip) function was added to the core as well as to the VST, both with and without unit scaling support. TableView performance when importing and formatting large tables, using multiple rules on a large number of conditionally formatted cells, has been improved. The APIs have been enhanced to support the preload maximum size, symbol formatting for scatter plots, and note editing in HyperGraph 3D.
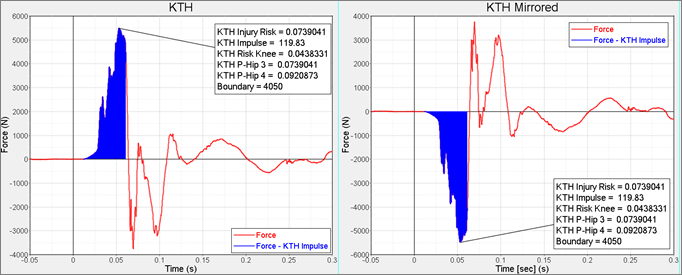
The KTH (Knee-Thigh-Hip) function calculates the injury risk for both HIII-M50 and HIII-F5 dummies. The function can calculate the complete injury risk or for knee and hip separately, in addition to the impulse and impulse curve. Macros to plot both the impulse curve and the KTH note are available in the VST, with and without unit scaling support.
A new function, "automir", automatically handles force inputs with a negative orientation, which makes reports much more robust for test data. The user can decide if the mirroring is triggered by the position of the curve centroid or the position of the min/max values relative to the x axis.

|
In the MediaView Options panel, the user can now modify the video by changing the brightness, contrast, gamma correction, and edge enhancement. The user should be aware that significant processing power is required to perform video enhancement for high-resolution videos, which can result in a performance decrease; edge enhancement, in particular, is very CPU-intensive.

|
The preload maximum memory allocation for HyperGraph result files can now be controlled via the Tcl API commands "pltIPlotManager SetPreloadMaximum” and “pltIPlotManager GetPreloadMaximum". This helps to prevent memory overflows for customizing solutions which post-process a large number of files.
|
The newly added APIs "plt3DINote SetPosition” and “plt3DINote GetPosition" allow the user-defined positioning of notes in HyperGraph 3D for customized solutions.
|
Additional ISO6487 Filters for CFC 600 and CFC 1000 have been added to the VST.

|
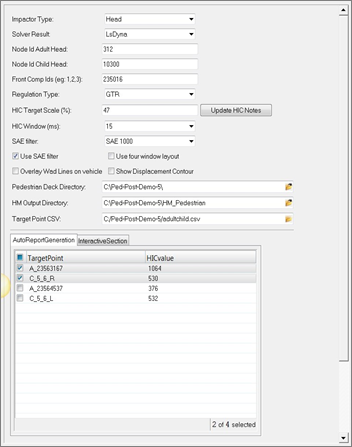
This process is now completed in two steps to get the HIC summary faster for large number of impact points.
| • | HIC summary option will calculate only the HIC using time history files and show the HIC map. |
| • | The report generation can be done on selected or all points. |
| • | HIC map can be created using EuroNCAP coding or GTR |
| • | Both adult and child points can be processed together |

|
A new property, "symbol size", has been added to the plot browser curve view, and it is now possible to define an individual color and size for each symbol via an API (for a customized scatter plot, for example):

|
| • | Curves can now be deleted by using the Delete key in the Plot browser’s curve view. |
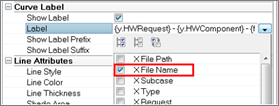
| • | A new Filename option without the full path has been added to the curve label properties in the Plot browser. |

|
| • | Legacy session files containing PamCrash 2015 .erfh5 files can be loaded with the new 2017 version. This fails in 14.0.130. |
| • | The slow performance of saving a session file with the option "Save all curve data to session file/ report template" starting with version 14.0.110 has been resolved. |
| • | Lengthy category labels displayed diagonally in HyperGraph bar charts will no longer be cut off in 2017. |
| • | When multiple lines were added to a HyperGraph Bar Chart in previous versions, all lines were displayed with the smallest range of all those lines. |
| • | Support for eroded energy components in LS-DYNA matsum files has been added in 2017. |
| • | LS-DYNA deforc files from WS50 Dummies failed to read into 14.0.110 and later because of their header format. 2017 is able to read those files. |
| • | For some LS-DYNA binout files, HyperGraph 14.0 and later failed to read a big number of curves at once. This behavior has been fixed. |
| • | The request labels shown in the Build Plots panel when reading jntforc results from LS-DYNA binout files have been modified to show the LS_DYNA keywords. HyperGraph reader versioning ensures legacy support so that session files created with versions prior to 2017 can be read without problems. |
| • | The issue that for some combinations of min/max axis values the top tic value on the vertical axis was missing no longer occurs in 2017. |
| • | If requests (such as node IDs) existed in result file A and were missing in result file B, report templates could display incorrect curves for these nodes if the template was created with result file A and applied with result file B. In 2017, these curves are no longer displayed. |
| • | The poor quality of PowerPoint Publishing Tag Table preview images for AVIs loaded in MediaView has been fixed. |
| • | The hide/unhide status of TableView headers will be saved in session files and report templates; this failed in previous versions. |
| • | Before 13.0.110, dragging all curves using CTRL+RMB was done in steps related to the tic increments of the related x- and y-axis. In 2017, the dragging is done continuously, and at the moment the user releases the mouse button, the axis values are rounded to the closest tic increment. |
| • | For some *.pch files, all curve points of the total response frequency values for modal participation data were read twice. This happened when the *.pch file had one block with complex data and one with scaled data. |
| • | In 2017, the formula used to calculate the OLC++ value will use the absolute OLC value, which results in different values then in 14.0.120 and later. In addition, the OLC value will always be returned as a positive value. |
| • | Editing entities of windows which are hidden in the graphics area but displayed in the plot browser was causing HyperGraph to crash. In the versions before 14.0.120, these windows were not displayed in the plot browser at all. In 2017, this behavior has been restored. |
Note: A hidden window can be created if the user creates curves in a multiple window page layout (e.g. 4 windows) and later changes the layout to a layout with less windows (e.g. 2 windows).
|


