46.1 - Lagrange Formulation |

|

|

|

|
|
46.1 - Lagrange Formulation |

|

|

|

|
TitleCylinder Expansion Test with Lagrange formulation |
|
||||||||||
Number46.1 |
|||||||||||
Brief DescriptionDetonation is initiated at the bottom of the explosive. Radial expansion of the cylinder is measured and compared to experimental data. |
|||||||||||
Keywords
|
|||||||||||
RADIOSS Options
|
|||||||||||
Input FileCylinder Test: <install_directory>/demos/hwsolvers/radioss/46_TNT_Cylinder_Expansion_Test/Lagrange/* |
|||||||||||
Technical / Theoretical LevelAdvanced |
|||||||||||
The purpose of this example is to show how to simulate the cylinder expansion test and compare the simulation result to experimental data.
A OFHC copper cylinder (1.53cm diameter, 0.26cm thickness, 30.5cm height) is filled with an explosive (TNT). Detonation is initiated at the bottom of the explosive. Radial expansion is measured at a length of 8*D cm.
Since this problem is axisymmetric, only a quarter of the cylinder is modeled.

Fig 1: Problem description for cylinder test
Units: cm, µs, g, Mbar
The TNT material uses Jones Wilkins-Lee Material (/MAT/JWL) and Lagrange formulation with the following characteristics:
| • | Initial density = 1.63 |
| • | A = 3.7121 |
| • | B = 0.0323 |
| • | R1 = 4.15 |
| • | R2 = 0.95 |
| • |
Chapman Jouget parameters enable detonation time to compute and burn fraction evolution:
| • | Detonation velocity D = 0.693 |
| • | Chapman Jouguet pressure PCJ = 0.21 |
| • | Detonation energy E0 = 0.07 |
#---1----|----2----|----3----|----4----|----5----|----6----|----7----|----8----|----9----|---10----| /MAT/JWL/2 TNT # RHO_I 1.63 0 # A B R1 R2 OMEGA 3.7121 .0323 4.15 .95 .3 # D P_CJ E0 .693 .21 .07 #---1----|----2----|----3----|----4----|----5----|----6----|----7----|----8----|----9----|---10----| |
Using Hydrodynamic Johnson-Cook material law (/MAT/LAW4), the copper cylinder material has the following characteristics:
| • | Initial density = 8.96 |
| • | E-Module = 1.24 |
| • | Poisson = 0.35 |
| • | A = 0.9e-3 |
| • | B = 0.292e-2 |
| • | N = 0.31 |
| • |
| • | C = 0.025 |
| • |
| • | M = 1.09 |
| • |
| • | Tmelt = 1656 |
The Gruneisen equation of state (/EOS/GRUNEISEN) is used for copper with the following characteristics:
| • | C = 0.394 |
| • | S1 = 1.489 |
| • |
| • | a = 0.47 |
| • | E0 = 8.96 |
#---1----|----2----|----3----|----4----|----5----|----6----|----7----|----8----|----9----|---10----| /MAT/HYD_JCOOK/1 Copper # RHO_I 8.96 # E0 nu 1.24 .35 # A B n epsmax sigmax .9E-03 .292E-02 .31 0 0.0066 # Pmin -1.E30 # C EPS_DOT)0 M Tmelt Tmax .25E-01 .1E-05 1.09 1656.0 1e30 # RHOCP .3461E-04 /EOS/GRUNEISEN/1 Copper # C S1 S2 S3 .394 1.489 0 0 # GAMMA0 ALPHA E0 RHO_0 1.97 .47 0 8.96 #---1----|----2----|----3----|----4----|----5----|----6----|----7----|----8----|----9----|---10----| |
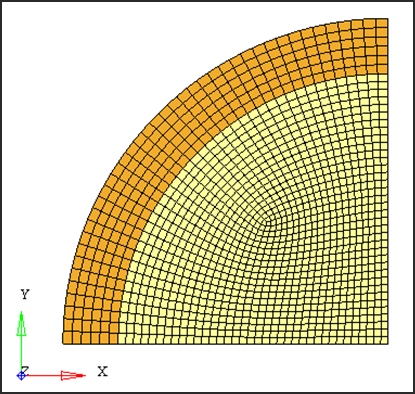
A 3D mesh is made of brick elements. The element size is approximately of 0.035 cm x 0.035 cm x 0.035 cm.
The mesh is dragged along the z direction (z = 30.5 cm). It is important to have no discontinuity in element volume in order to ensure a good propagation of detonation wave and shock wave.

Fig 2: Model mesh
Due to the symmetries of the model, a quarter of the cylinder is modeled. Boundary conditions are set on the yOz plan at x = 0 (Tx = 0) and on the xOz plan at y = 0 (Ty = 0) to simulate the symmetry.
A planar detonation wave is defined at the bottom of the cylinder.
In order to plot the curve of radial expansion, displacements of node n 201 520 at z = 24.48 cm on the outer wall of the copper cylinder are saved in time history. It corresponds to L/D=8 in agreement with experimental protocol.
![]()
A scale factor of 0.5 (on time step for all elements) is used for this type of application.
In solid properties, qa and qb default values are used. These values have to be changed depending of the formulation (ALE, Euler).
| • | Isolid is set to 14 for copper solid properties. |
#---1----|----2----|----3----|----4----|----5----|----6----|----7----|----8----|----9----|---10----| /PROP/SOLID/2 TNT # Isolid Ismstr Icpre Inpts Itetra Iframe dn 0 0 0 0 0 0 0 # q_a q_b h LAMBDA_V MU_V 0 0 0 0 0 # dt_min istrain IHKT 0 0 0 #---1----|----2----|----3----|----4----|----5----|----6----|----7----|----8----|----9----|---10----| |
#---1----|----2----|----3----|----4----|----5----|----6----|----7----|----8----|----9----|---10----| /PROP/SOLID/1 Copper # Isolid Ismstr Icpre Inpts Itetra Iframe dn 0 0 0 0 0 0 0 # q_a q_b h LAMBDA_V MU_V 0 0 0 0 0 # dt_min istrain IHKT 0 0 0 #---1----|----2----|----3----|----4----|----5----|----6----|----7----|----8----|----9----|---10----| |
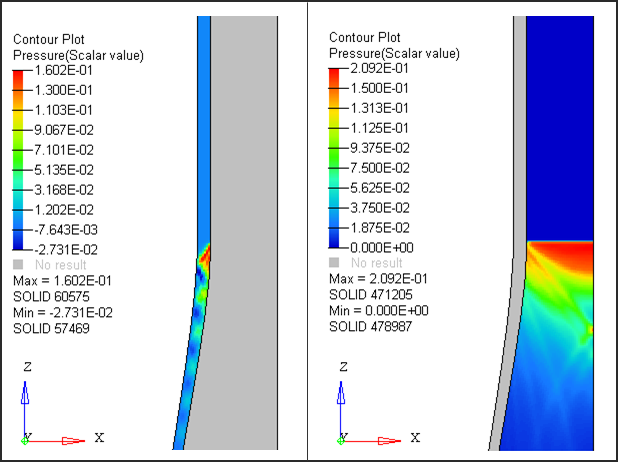
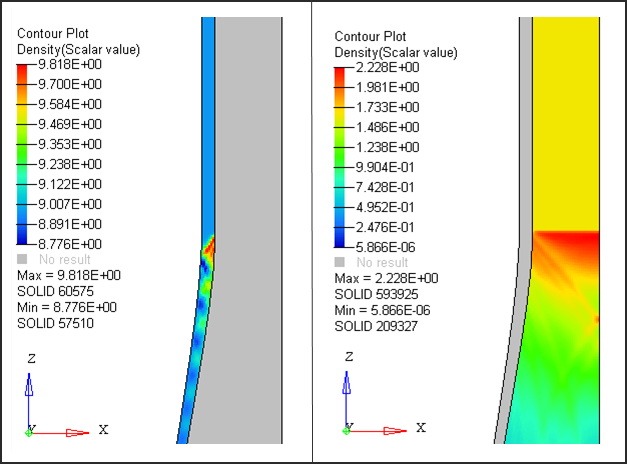
The two following diagrams display the pressure and density in the cylinder and the explosive.

Fig. 3: Pressure distributed in copper and TNT at time = 13µs.

Fig. 4: Density distributed in copper and TNT at time = 13 µs.
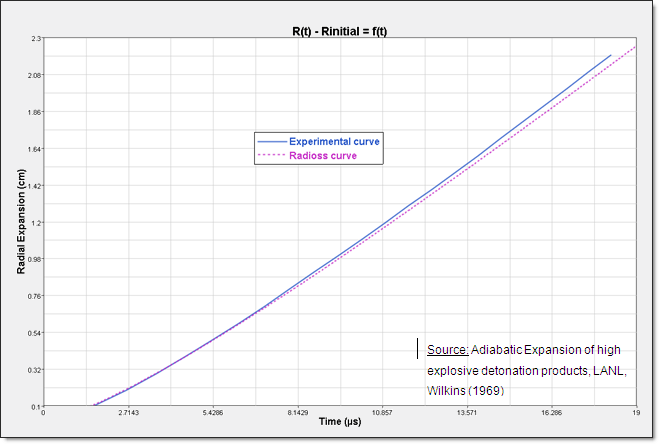
The following diagram shows the comparison between the experimental and simulation measurement of radial expansion.

Fig. 5: Comparison between experimental results and simulation results
Good correlation between experimental and simulation results. A thinner meshing could improve the correlation between simulation and experimental curves.
Elapsed time for simulation: t = 11 441 s, 8514 cycles, (4 cpu intel core i7 Q 840 @ 1.87 GHz).
As the model is Lagrangian, the mesh becomes very distorted at the end of the simulation to obtain a proper mesh, it is possible to use the Euler method.
[1] Adiabatic Expansion of high explosive detonation products, LANL, Wilkins (1969)
[2] A Constitutive model and data for metals subjected to large strains, high strain rates and high temperatures, Gordon R. Johnson, William H. Cook