|
»Click here to display Table of Contents«
|

|
.out file |

|

|

|

|
|
|
.out file |
|
|
|

|
.out file
|
»Click here to display Table of Contents«
|
|
.out file |
|
|
|
|
|
|
.out file |
|
|
|
|
The .out file is an ASCII format results file.
File Creation
This file is always created.
File Contents
This file provides a commentary on the solution process.
File Format
The file starts with an OptiStruct banner, and is followed by three sections which outline the problem definition:
| • | Optimization File and Parameter Information |
| • | Finite Element Model Data Information |
| • | Optimization Problem Parameters |
Following these, calculated estimates on required memory and disk space are provided under the headings:
| • | Memory Estimation Information |
| • | Disk Space Estimation Information |
The Analysis Results or Optimization History information sections provide the following information (Some information is output for each iteration during optimization, or as a summary for nonlinear analysis):
| • | Element quality information (If any of the warning or error limits are exceeded) |
| • | Global force balance tables for each linear static subcase. (When SPCFORCE or GPFORCE is a requested output). |
| • | Objective function value |
| • | Maximum constrain violation % and the ID of this constraint. |
| • | Design volume fraction value if topology design variables are present, otherwise the total volume is given, and the total mass. |
| • | Individual subcase compliances and weightings and the total weighted compliance. |
| • | Retained responses table |
If the constraint violation is higher than 1%, the constraint is flagged as V (violated). If the violation is lower than 1%, it is flagged as A (active). For stress constraint in topology optimization, if there is no violation, it is flagged as Inactive; otherwise, it is flagged as Active.
| • | User-requested responses table (when RESPRINT or DREPORT is a requested output) |
| • | Most violated constraints table |
| • | Design variable values and bounds if shape or size design variables are present. |
| • | Designed property/material/connectivity items table if size design variables are present. |
| • | A list of calculated buckling modes and their eigenvalues. |
| • | A list of calculated normal modes, their frequencies, eigenvalues and weighting and the value of the frequencies weighted across the reciprocal eigenvalues. |
| • | Center of Gravity table |
| • | Moment of Inertia table |
| • | Regional compliance table |
Manufacturing Constraints table for Composite Optimization
An example table is shown below:
COMPOSITE MANUFACTURING CONSTRAINTS
----------------------------------------------------------------------------
User-ID Constraint Information Status Max Avg Pct
Type Bound Group Elem Viol. Viol. Viol.
----------------------------------------------------------------------------
1 PLYPCT LOWER 0.0 ALL Violated 12.1 2.6 2.5
1 PLYPCT LOWER 90.0 ALL Violated 3.0 1.6 0.2
1 PLYPCT UPPER 90.0 ALL Violated 31.8 5.3 14.6
----------------------------------------------------------------------------
Where,
Max Viol. – Represents the maximum violation of the specified manufacturing constraint (Type).
Avg Viol. – Represents the average violation of all the violated elements for the specified manufacturing constraint (Type).
Pct Viol. – Represents the percentage of the total number of elements in the design space for which the specified manufacturing constraint (Type) is violated.
The Constraint Information columns are self-explanatory and may vary from one constraint type to the other.
Nonlinear Iteration Summary table for Nonlinear Analysis
An example table is shown below:
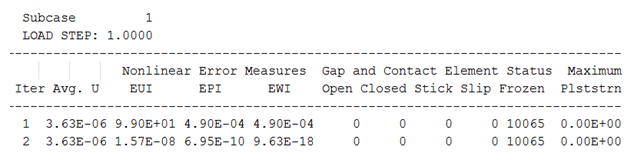
Where,
Avg. U – Represents the average displacement of all elements for a particular iteration for a subcase
EUI – Represents the relative error in displacements
EPI – Represents the error in terms of loads
EWI – Represents the error in terms of work
Refer to the Nonlinear Convergence Criteria section of Small Displacement Nonlinear Analysis in the User’s Guide for more information.
Maximum Plststrn – Represents the Maximum Plastic Strain
The Gap and Contact Element Status columns are self-explanatory.
At the end of the file, the following information is provided:
| • | Resource usage information |
| • | Compute time information |
| Note: | The residual energy ratio (Epsilon) is always printed to the .out file, whenever applicable. It does not require the usage of GPFORCE. Epsilon output is not available for large displacement analysis, MPC-based linear gap, or fast contact analysis. |