|
»Click here to display Table of Contents«
|

TABLED1 |

|

|

|

|
|
TABLED1 |
|
|

|

|
|
»Click here to display Table of Contents«
|
TABLED1 |
|
|
|
|
|
TABLED1 |
|
|
|
|
Bulk Data Entry
TABLED1 – Dynamic Load Tabular Function, Form 1
Description
Defines a tabular function for use in generating frequency-dependent and time-dependent dynamic loads.
Format
(1) |
(2) |
(3) |
(4) |
(5) |
(6) |
(7) |
(8) |
(9) |
(10) |
TABLED1 |
TID |
XAXIS |
YAXIS |
FLAT |
|
|
|
|
|
|
x1 |
y1 |
x2 |
y2 |
x3 |
y3 |
x4 |
y4 |
|
|
x5 |
y5 |
… |
… |
… |
… |
… |
… |
|
|
Field |
Contents |
TID |
Table identification number. No default (Integer > 0) |
XAXIS |
Specifies a linear or logarithmic interpolation for the x-axis. See comment 5. Default = LINEAR (LINEAR or LOG) |
YAXIS |
Specifies a linear or logarithmic interpolation for the y-axis. See comment 5. Default = LINEAR (LINEAR or LOG) |
FLAT |
Specifies the handling method for y-values outside the specified range of x-values in the table. = 0: If an x-value input is outside the range of x-values specified on the Table, the corresponding y-value look up is performed using linear extrapolation from the two start or two end points. = 1: If an x-value input is outside the range of x-values specified on the Table, the corresponding y-value is equal to the start or end point, respectively. Default = 0 (0 or 1) |
x#, y# |
Tabular values. Any x, y pair may be ignored by placing 'SKIP' in either of the two fields used for that entry. No default (Real or ENDT) |
| 1. | xi must be in either ascending or descending order, but not both. |
| 2. | Discontinuities may be specified between any two points except the two starting points or two end points. For example, in Figure 1 discontinuities are allowed only between points x2 through x7. Also, if y is evaluated at a discontinuity, the average value of y is used. In Figure 1, the value of y at x = x3 is y = (y3+y4)/2. |
| 3. | At least one continuation entry must be specified. |
| 4. | The end of the table is indicated by the existence of 'ENDT' in either of the two fields following the last entry. An error is detected if any continuations follow the entry containing the end-of-table flag 'ENDT'. |
| 5. | For FLAT=0 (default), TABLED1 uses the algorithm: |
y = yT (x)
Where, x is input to the table and y is returned. The table look-up is performed using interpolation within the table and linear extrapolation outside the table using the two starting or end points. See Figure 1. The algorithms used for interpolation or extrapolation are:
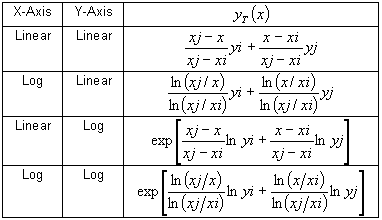
Where, xj and yj follow xi and yi.
No warning messages are issued if table data is input incorrectly.
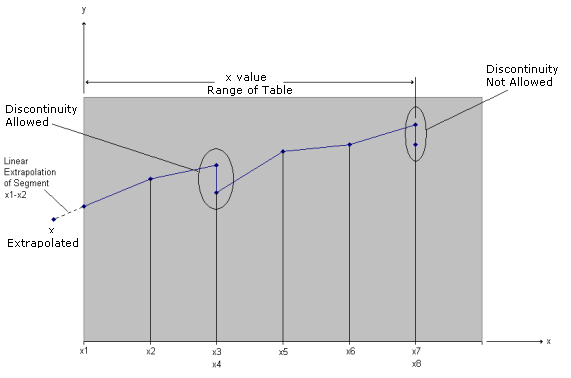
Figure 1. Example of Table Extrapolation and Discontinuity
For FLAT=1, the same algorithm as FLAT=0 is used, except that values outside the range are not extrapolated. The corresponding start or end point y-values are used for all y-values outside the range.
| 6. | Linear extrapolation is not used for Fourier transform methods. The function is zero outside the range of the table. |
| 7. | For frequency-dependent loads, x# is measured in cycles per unit time. |
| 8. | Tabular values on an axis if X-Axis or Y-Axis = LOG must be positive. A fatal message will be issued if an axis has a tabular value < 0. |
| 9. | This card is represented as a loadcollector in HyperMesh. |
See Also: