In this tutorial you will learn how to:
| • | Compare results from a single solver across two HyperView versions. |
Step 1: Compare result from a Solver across different HV versions
| 1. | From the Result tab, select the Result comparison HV versions tab. |
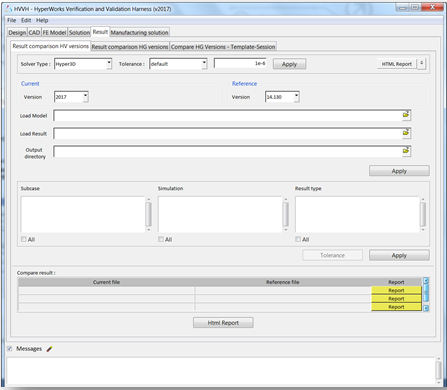
| 2. | For Solver type, select Hyper3D. |
| 3. | Leave Tolerance as default (1e-06). |
| 5. | Under Current, set Version to 2017. |
| 6. | Under Reference, set Version to 14.130. |
| 7. | For Load Model, click the open file icon,  , to load the BOXBEAM.h3d, located in , to load the BOXBEAM.h3d, located in
..\tutorials\hvvh\Result\ResultcomparisonHVVersions. |
| 8. | For Load Result click the open file icon, , to load the BOXBEAM.h3d, located in
..\tutorials\hvvh\Result\ResultcomparisonHVVersions. |
| 9. | For the Output directory field, use the open file icon, , to select an output directory. |
The results available (Subcase, Simulation, and Result type) in the result file are loaded in their respective windows.
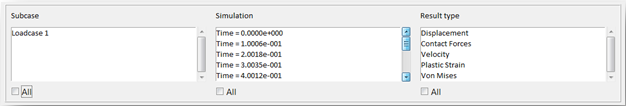
| 11. | Select All under each window and click Apply. |
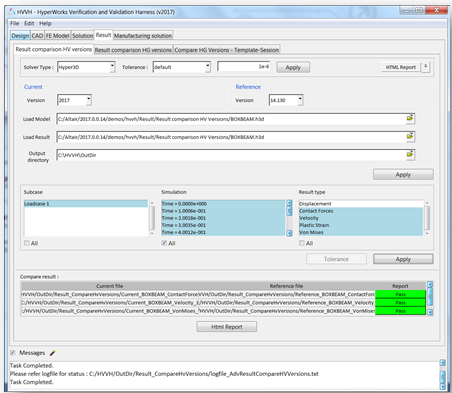
Results comparison of the current results and reference results are generated.
| 12. | In the Messages window, the run details are displayed along with the log file location. |
| 13. | In case the difference > tolerance, it is indicated as Fail, otherwise, they are shown to Pass. |
| 14. | Click HTML Report to open the report. Across two HyperView versions, the solver results are compared. Comparison of different data types are available. For example, for a vector (Displacement) all components Magnitude, X-displacement, Y-displacement, and Z-displacement are compared for the entire model and the results are shown. |
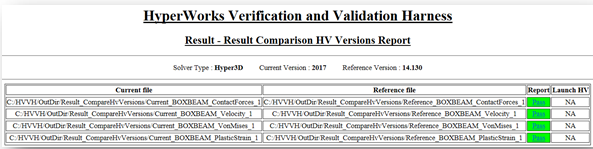
| 15. | Click Pass/Fail in the HTML report to open a detailed comparison report. |
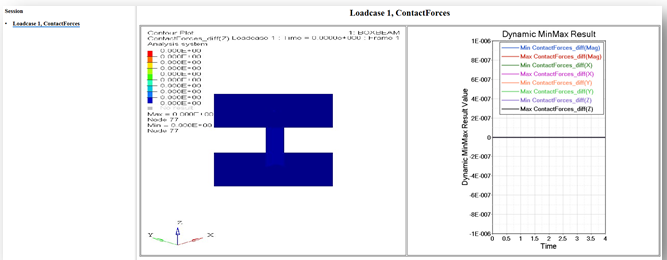
| 16. | In the report above, the left window displays the diff contour (Current-Reference) and right window displays the diff plot in HyperGraph (see image below). |
| 17. | Click the left window to open the diff-values H3D in HyperView Player. |
| 18. | Click the right window to maximize/minimize the plot. |
| 19. | If there is any case of difference > tolerance, it is indicated as Fail, otherwise Pass. |
Step 2: Result comparison for different solver results across two HyperGraph versions.
Result comparison for different solver results across two HyperGraph versions.
| 1. | From the Result tab, select the Result comparison HG versions tab. |
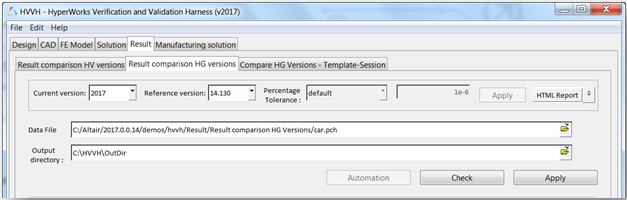
| 2. | For Current version, select 2017. |
| 3. | For Reference version, select 14.130. |
| 5. | For Data File, click the open file icon, , to load the car.pch file, located in
..\tutorials\hvvh\Result\ResultcomparisonHGVersions. |
| 6. | For the Output directory field, use the open file icon, , to select an output directory. |
| 7. | Activate the Plot only failed option. |
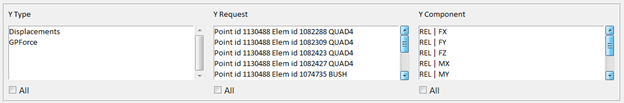
| 9. | Select each All under the Type/Request/Component columns, and click the second Apply button. |
A results comparison of the current results and reference results are generated.
| 10. | In the Messages window, the run details are displayed along with the log file location. |
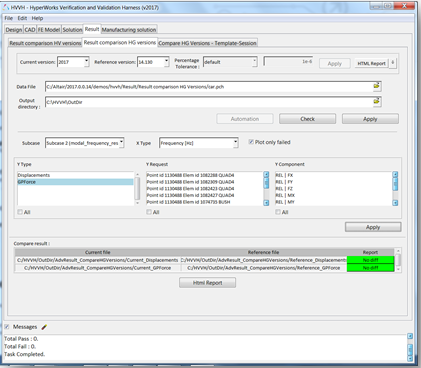
| 11. | Click HTML Report to open the report. A comparison of different type, request, and component (TRC) is available for the same result file across two HyperGraph versions. |
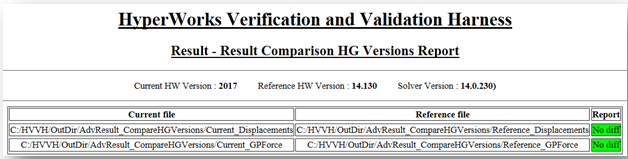
As the results match, the plots coincide and a difference curve will be a straight line along the X-axis, or points very close to it.
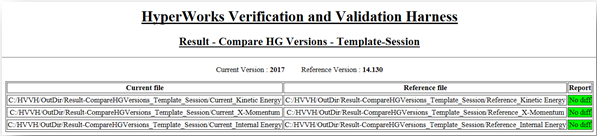
Step 3: HyperGraph Versions - Template-Session
In this step, results comparison for different solver results across two HyperGraph versions using template and session files.
| 2. | From the Result tab, select the Compare HG Versions - Template-Session tab. |
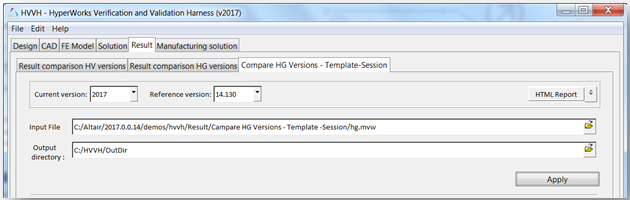
| 2. | For Current version, select 2017. |
| 3. | For Reference version, select 14.130. |
| 5. | For Data File, click the open file icon, , to load the hg.mvw file, located in
..\tutorials\hvvh\Result\CompareHGVersions-Template-Session. |
| 6. | For the Output directory field, use the open file icon, , to select an output directory. |
| 7. | Activate the Plot only failed option. |
| 8. | Activate the Visible Only option. |
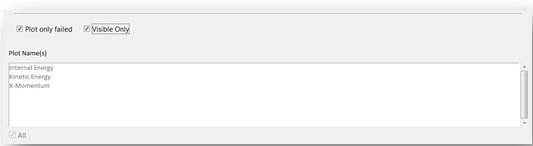
Plots that are available in the result file are listed.
Results comparison of the current results and the reference results are generated.
| 11. | In the Messages window, the run details are displayed along with the log file location. |
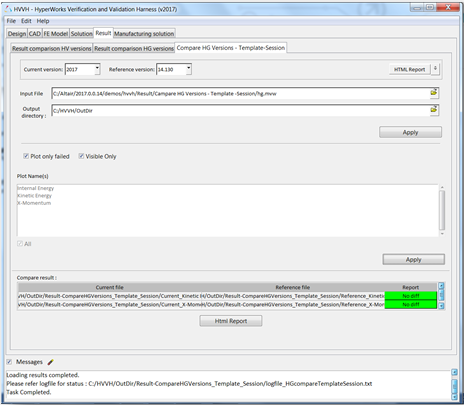
| 12. | Click HTML Report to open the report. Comparisons of different type, request, and components (TRC) are available. |
As the results match, the plots coincide and a difference curve will be a straight line along the X-axis, or points very close to it.


