|
»Click here to display Table of Contents«
|

Solution Tab |

|

|

|

|
|
Solution Tab |
|
|

|

|
|
»Click here to display Table of Contents«
|
Solution Tab |
|
|
|
|
|
Solution Tab |
|
|
|
|
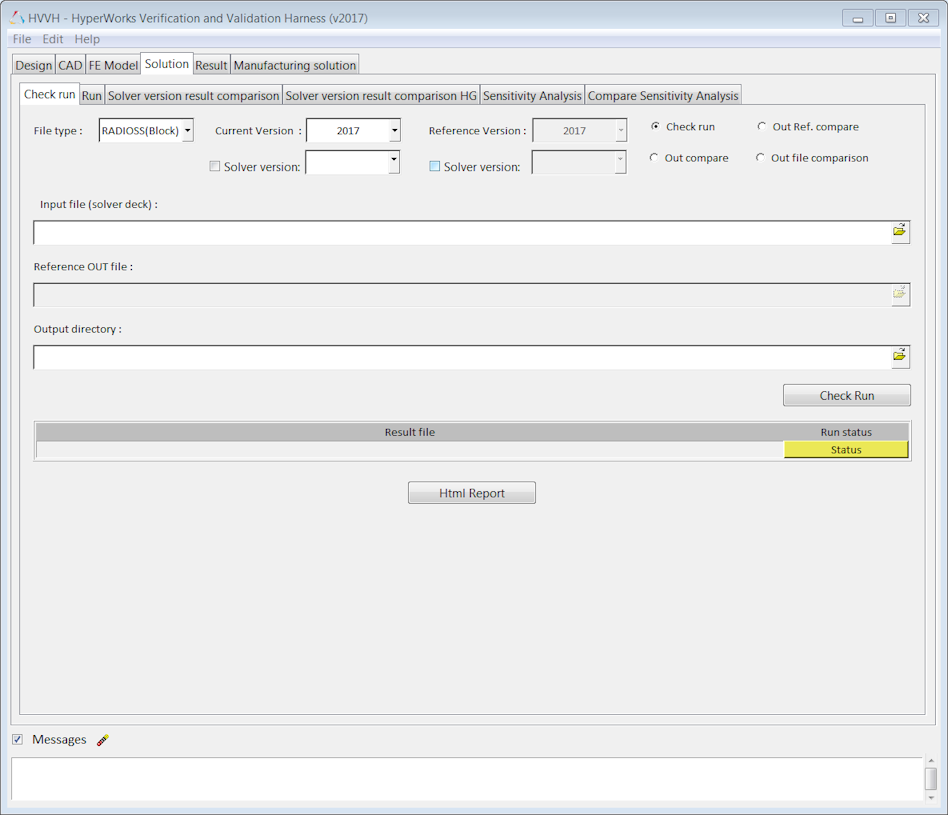
Use the Solution tab for a solver check run and to submit a job (LsDyna, RADIOSS Block, and OptiStruct are supported).
The model files generated in the pre-processing stage (last step) can be validated for solver data accuracy using this "check run".
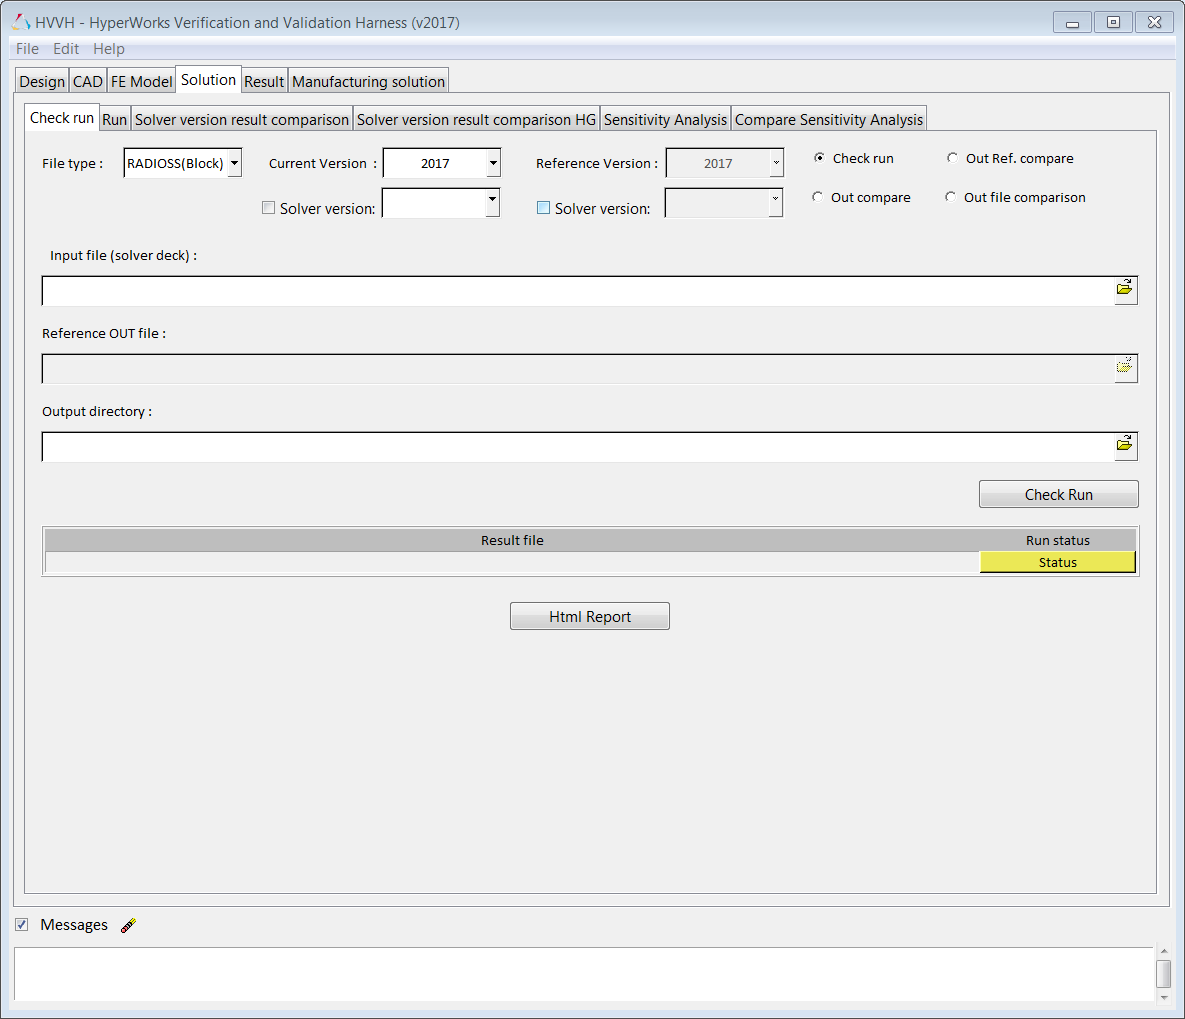
Solution tab
|
|||||||||
File type |
From the File type drop-down menu, select a solver type. |
||||||||
Current/Reference |
Select the Current/Reference HyperWorks version number from the list. |
||||||||
Input file |
Click the file open icon to select the input/.out file. |
||||||||
Output directory |
Click the file open icon to select your output directory to store your results file. |
||||||||
OUT file comparison |
|
||||||||
Check Run |
Click Check Run to output your solution. |
||||||||
Status |
Under Result file, click Status to view the status of the solver model check run. |
||||||||
Message log file |
A dynamically created message log file displays the current status of processes in progress. Click on a Status/Diff button to display the respective report. The message log file is a text file and is saved to your output directory. |
||||||||
Html Report |
Generates an HTML report of your session information for any number of files run through the process. |
||||||||
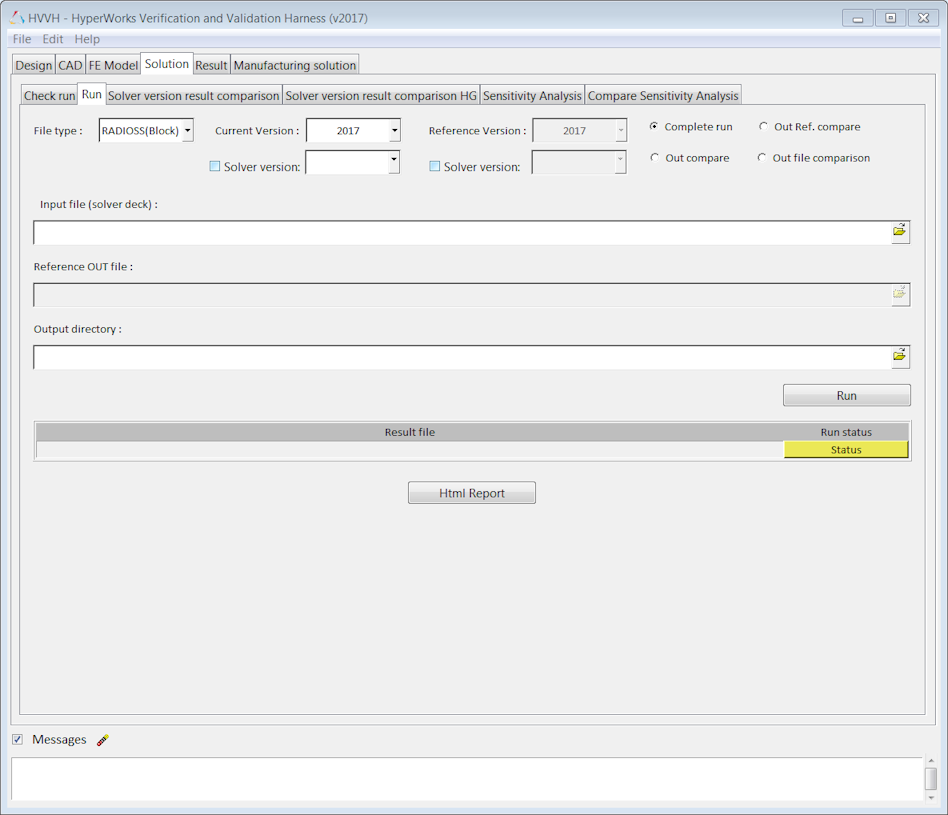
File type |
From the File type drop-down menu, select a solver type. |
||||||||
Current/Reference |
Select the Current/Reference HyperWorks version number from the list. |
||||||||
Input file |
Click the file open icon to select the input file/.OUT file |
||||||||
OUT file comparison |
|
||||||||
Output directory |
Click the file open icon to select your output directory to store your results file. |
||||||||
Run |
Click Run to output your solution. |
||||||||
Status |
Click Status to view the status of the solver model check run. |
||||||||
Message log file |
A dynamically created message log file displays the current status of processes in progress. Click on a Status/Diff button to display the respective report. The message log file is a text file and is saved to your output directory. |
||||||||
Html Report |
Generates an HTML report of your session information for any number of files run through the process. |
||||||||
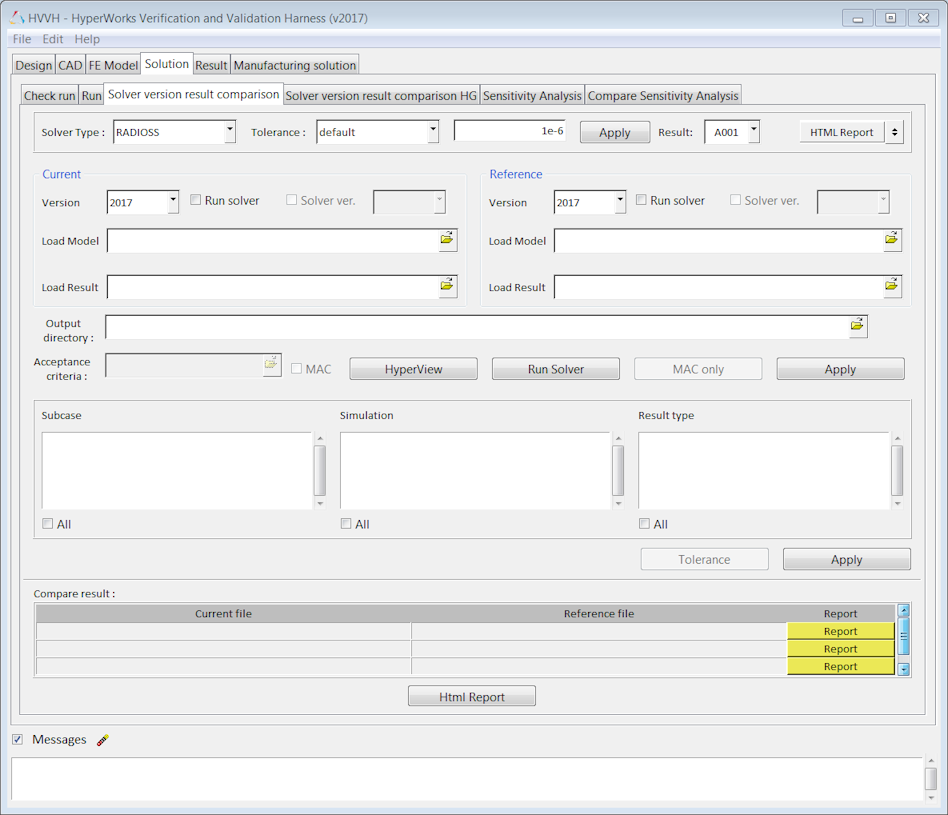
Solver version result comparison |
|
Solver |
From the Solver drop-down menu, select a solver whose results are to be compared. Options include RADIOSS and OptiStruct. |
Tolerance |
The value used to set the tolerance for the difference in values between the reference and current version result files during comparison. Default - 1e-6 for Scalar, Tensor, and Vector, if not individually chosen. Scalar – Enter values if different for the scalar result type. Vector – Enter values if different for the vector result type. Tensor – Enter values if different for the tensor result type. User Defined – Set the individual tolerance value for all data types. Click Apply to set new values (enter the values in the text box). |
Result |
From the Result drop-down menu, select the result type. Dynamically loads the selected result file type under Load Result on Run Solver. |
PPT/HTML Report |
Use one of these options to generate a PowerPoint or HTML report of the result value comparison. For Pass - This returns a detailed report containing one slide per data type across load cases. For Fail - In case of a failure, one slide per load case for each datatype is published so that it is easy to identify the load case that contains a difference in values. |
Current/Reference |
The Current and Reference sections contain the following options: Version - Select the solver version from the drop-down menu. Run Solver - This is required if the result files are not available, and the solver needs to be run to generate result files (for only one or both versions). The RADIOSS or OptiStruct solvers invoked in batch mode and the model selected through Load Model are run, and the result file path is populated in the Load Result field. Load Model - Select the HyperView model file. Load Result - Select the HyperView results file (if Run solver is not selected). |
Output directory |
Click the file open icon to select your output directory to store your results. Click Run Solver if the Run solver check box is activated. The RADIOSS or OptiStruct solvers invoked in batch mode and the model selected through Load Model are run, and the result file path is populated in the Load Result field. Apply - Click Apply to generate data to compare the results with combinations of the following: Subcase, Simulation and Datatype. |
HyperView |
Click the HyperView button to launch HyperView interactive. Use the set of commands below for result comparison: ::Displaycontour – Applies the contour to the Reference result. ::Applytolerance – Applies the tolerance. ::Diffcontour – Compares the Current and Reference results for the selected datatype. |
Solver ver. |
If HyperWorks contains different versions of solver executables, they will be listed here. You can add a different version of an executable using Edit > Config > Solver executable version. Note: The HyperWorks version and solver executable version should be same. |
SubcaseSimulationResult Type |
Select any combination of Subcase, Simulation and Result type from the populated areas. Click All to select all items listed. |
Apply |
Click Apply to generate data to compare the results with combinations of the following: Subcase, Simulation and Datatype. |
Tolerance |
Click Tolerance to list all the Result Types in a table. Set the individual tolerance for each data type. |
Compare result |
The Compare result section displays the current file and the corresponding Reference file. Click Report to display the diff report detailing the differences between files. |
Message log file |
A dynamically created message log file displays the current status of processes in progress. Click on a Status/Diff button to display the respective report. The message log file is a text file and is saved to your output directory. |
Html Report |
Generates an HTML report of your session information for any number of files run through the process. |
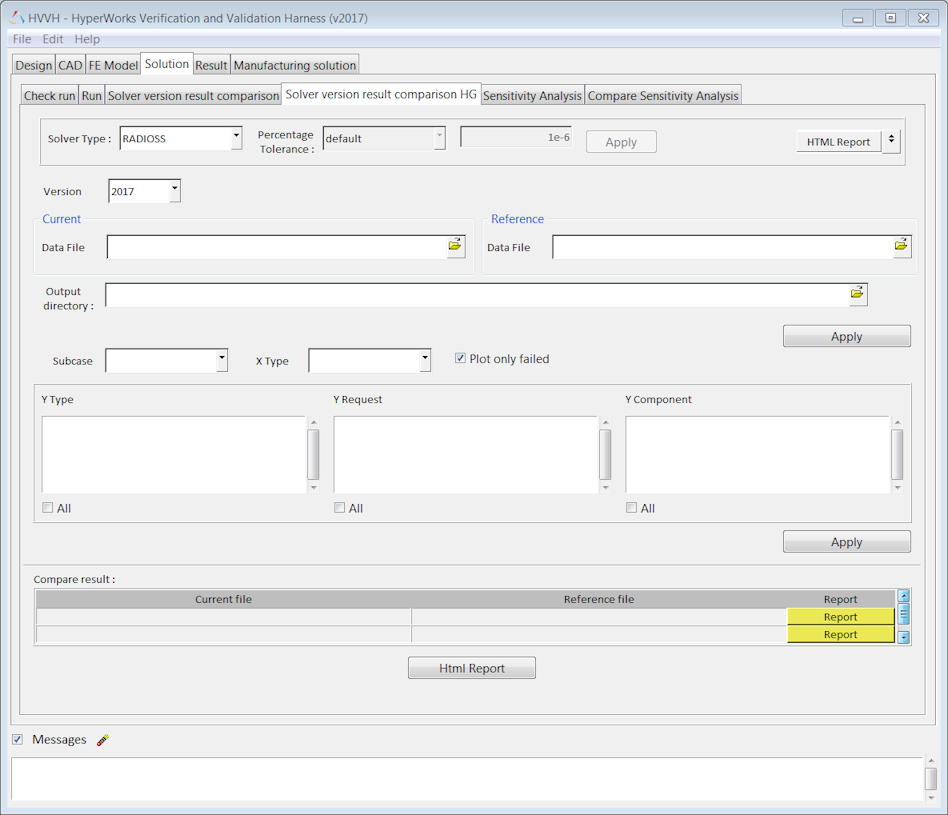
The Solver version result comparison HG tab performs time history comparisons. From this tab, you can perform the curve super positioning of the current and reference version result files and plot the differences in curves. |
|
|
|
HW Version |
Select the current HyperWorks version number from the drop-down menu. |
Solver Type |
Select RADIOSS or OptiStruct as the solver type from the drop-down menu. |
PPT ReportHTML Report |
PPT Report - Select this option to have your results displayed in a PowerPoint report. HTML Report - Select this option to have your results displayed in HTML. Use one of these options to generate a PowerPoint or HTML report of the result value comparison. |
Current and Reference |
The Current and Reference sections contain the following option: Data File - Click the file open icon, |
Output directory |
Click |
Apply |
Click Apply to extract TRC information from the data file. |
Subcase |
Select a subcase from drop-down menu. |
X Type |
Select an X type from the drop-down menu. |
Plot only failed |
Activate the Plot only failed check-box to plot-only failed graphs. |
Y TypeY RequestY Component |
Select any combination of Y Type, Y Request, and Y Component from the populated areas. |
Apply |
Click Apply to generate TH plots with the selected Y Type, Y Request, and Y Component. |
Compare result |
The Compare result section displays the current file and the corresponding Reference file. Click Report to display the diff report detailing the differences between the Current and Reference data files. |
Messages |
Click Messages to view any error messages. |
Html Report |
Generates an HTML report of your session information for any number of files run through the process. |
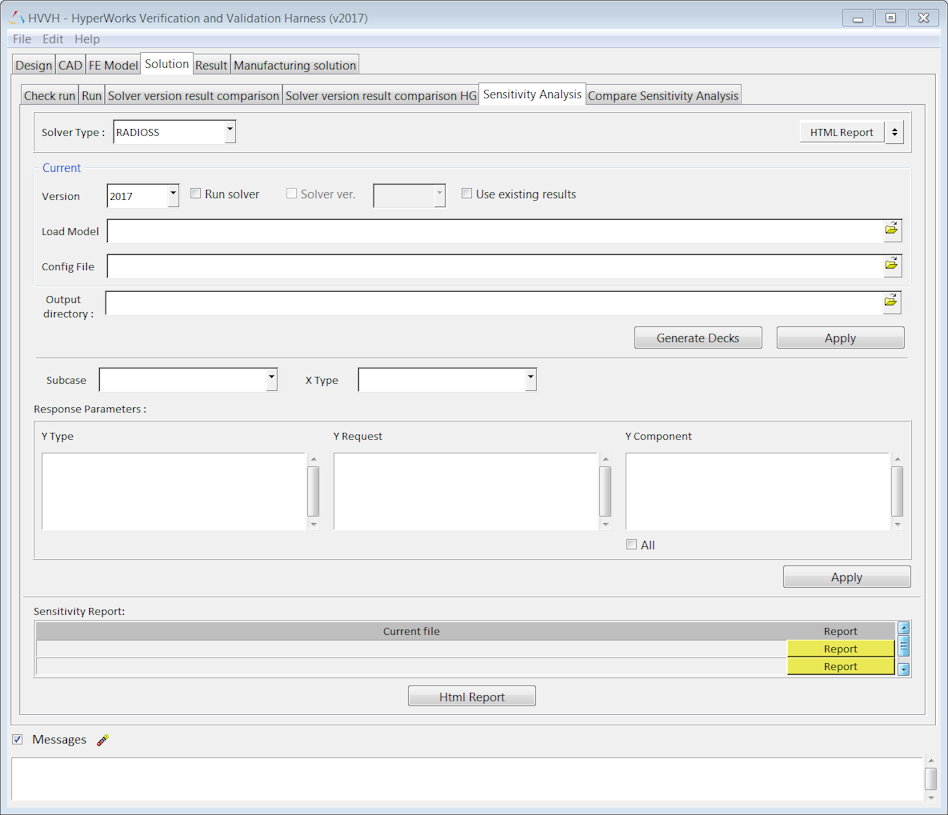
Use the Sensitivity Analysis and Compare Sensitivity Analysis tabs to compare sensitivity data across two versions of RADIOSS/OptiStruct. You can maintain a config file that contains the parameter(s) to change for the sensitivity study. Based on the config file, a certain number of decks are generated and solved, and a report is generated comparing the sensitivity corridor, response curve (Time vs Response), and statistical details.
|
|
Solver Type |
Select RADIOSS or OptiStruct as the solver type from the drop-down menu. |
PPT ReportHTML Report |
PPT Report - Select this option to have your results displayed in a PowerPoint report. HTML Report - Select this option to have your results displayed in HTML. Use one of these options to generate a PowerPoint or HTML report of the result value comparison. |
Current Version |
The Current sections contain the following options: Version - Select the solver version from the drop-down menu. Run Solver - This is required if the result files are not available, and the solver needs to be run to generate result files. The RADIOSS or OptiStruct solvers invoked in batch mode and the model selected through Load Model are run, and the result file path is populated in the Load Result field. |
Solver ver. |
If HyperWorks contains different versions of the solver executable's, they will be listed here. You can add a different version of an executable using Edit > Config > Solver executable version. Note: The HyperWorks version and solver executable version should be same. |
Use existing results |
Click Use existing results and select Result directory where the results already exist. |
Load Model |
Click the file open icon, |
Config File |
Click the file open icon, |
Output directory |
Click |
Generate Decks |
It generates a number of solver decks based on the seed values in the Config file. |
Run Solver |
It generates a number of solver decks based on the seed values in the Config file and starts the solver. |
Apply |
Click Apply to extract TRC information from the data file. |
Subcase |
Select Subcase from the drop-down menu. |
X Type |
Select X-Type from the drop-down menu. |
Response Parameters |
Select any combination of Y Type, Y Request, and Y Component from the populated areas. Click All to select all TRC items. |
Apply |
Click Apply to generate a sensitivity report. |
Sensitivity Report |
The Sensitivity Report section displays the current file and the corresponding Reference file. Click Report to display sensitivity corridor, response curve (Time Vs Response), and statistical details. |
Messages |
Click Messages to view any error messages. |
Html Report |
Generates an HTML report of your session information for any number of files run through the process. |
|
|
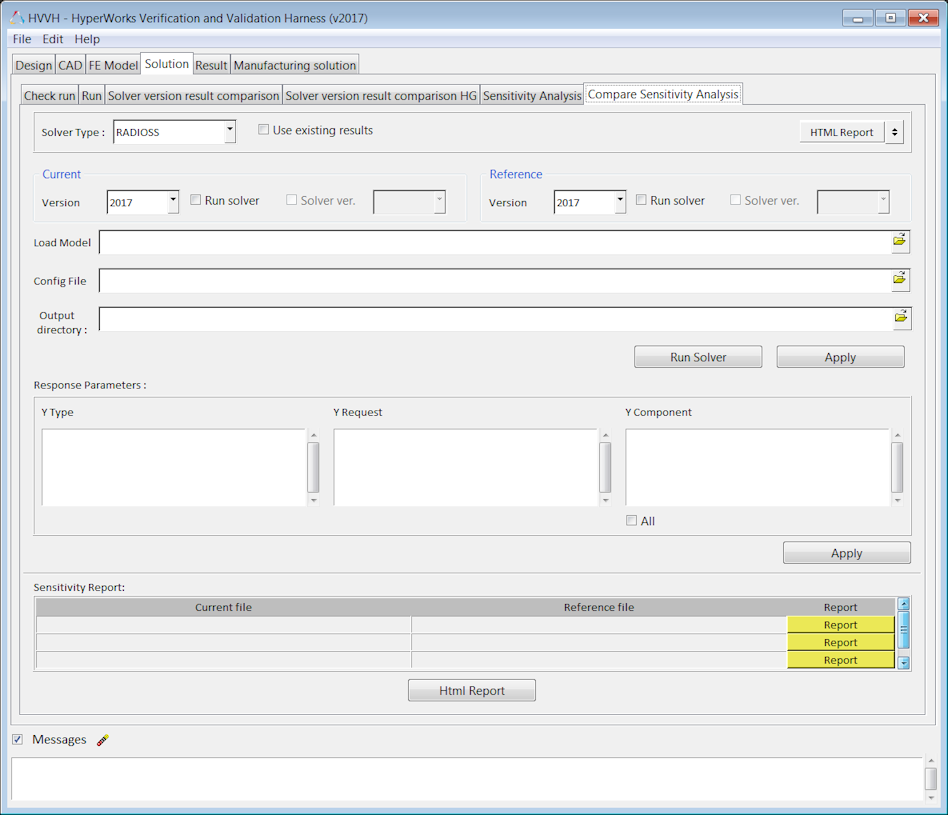
Solver Type |
Select RADIOSS or OptiStruct as the solver type from the drop-down menu. |
PPT ReportHTML Report |
PPT Report - Select this option to have your results displayed in a PowerPoint report. HTML Report - Select this option to have your results displayed in HTML. Use one of these options to generate a PowerPoint or HTML report of the result value comparison. |
Current Version |
The Current section contains the following options: Version - Select the solver version from the drop-down menu. Run Solver - This is required if the result files are not available, and the solver needs to be run to generate the result files. Solver ver. - If HyperWorks contains different versions of the solver executables, they will be listed here. You can add a different version of an executable using Edit > Config > Solver executable version. Note: The HyperWorks version and solver executable version should be same. |
Reference Version |
The Reference section contains the following options: Version - Select the solver version from the drop-down menu. Run Solver - This is required if the result files are not available, and the solver needs to be run to generate the result files. Solver ver. - If HyperWorks contains different versions of solver executable's, they will be listed here. You can add a different version of an executable using Edit > Config > Solver executable version. Note: The HyperWorks version and solver executable version should be same. |
Load Model |
Click the file open icon, |
Config File |
Click the file open icon, |
Output directory |
Click |
Run Solver |
It generates a number of solver decks in Current/Reference, based on the seed values in the Config file and starts the solver. |
Apply |
Click Apply to extract the TRC information from the data file. |
Response Parameters |
Select any combination of Y Type, Y Request and Y Component from the populated areas. Click All to select all TRC items. |
Apply |
Click Apply to generate the Sensitivity report. |
Sensitivity Report |
The Sensitivity Report section displays the current file and the corresponding Reference file. Click Report to display the sensitivity corridor, response curve (Time Vs Response), and statistical details. |
Messages |
Click Messages to view any error messages. |
Html Report |
Generates an HTML report of your session information for any number of files run through the process. |